データは
LandBrowser
で入手
(参考)
Landsat-8が捉えた西之島付近の噴火
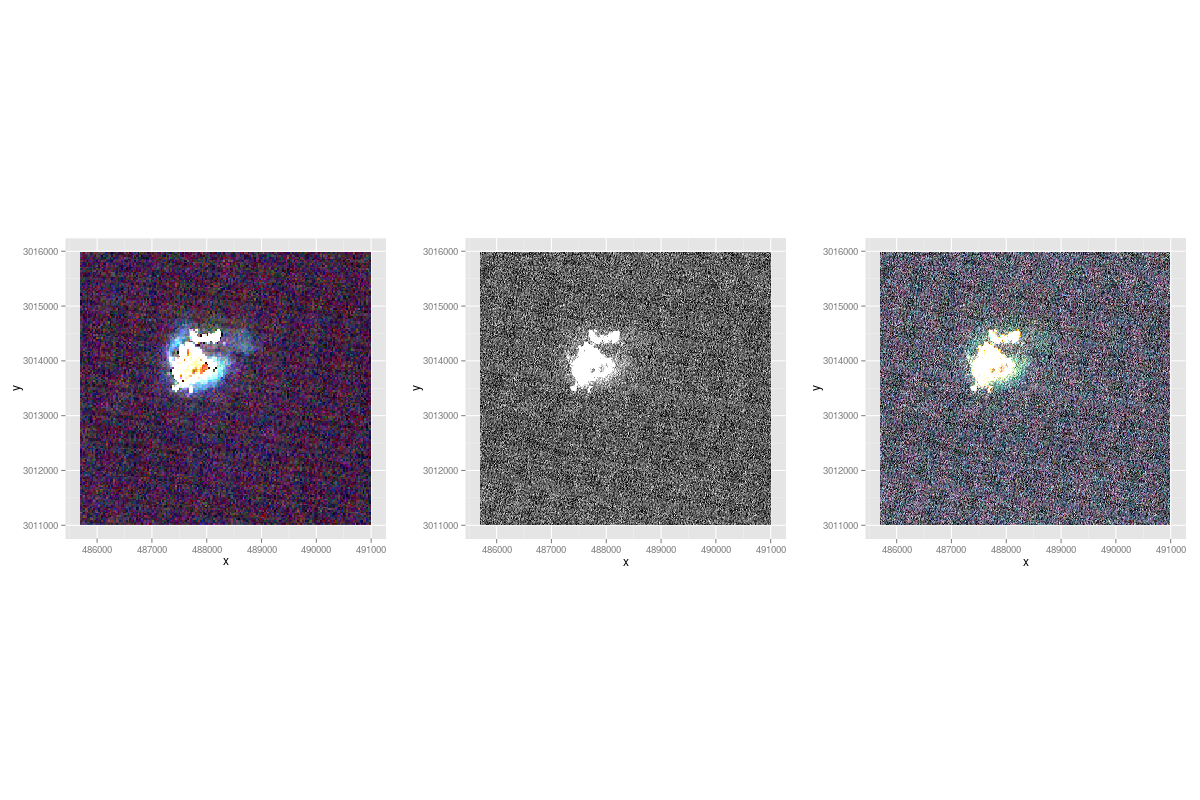
Landsat-7 (噴火前:2000-12-28)
西之島 path:105 row:41 Date:2000-12-28T00:00:00Z
(準備)
RStoolboxパッケージをインストール
1 2
| #library(devtools) #install_github("bleutner/RStoolbox")
|
データは解凍して/home/user/R/work/landsat7/L7E105041_04120001228 へ
1 2 3 4 5 6 7 8 9 10 11 12 13 14 15 16 17 18 19 20 21 22 23 24 25 26 27 28 29
| setwd("/home/user/R/work/landsat7/L7E105041_04120001228") library("raster") A <- stack(c("L71105041_04120001228_B10.TIF","L71105041_04120001228_B20.TIF","L71105041_04120001228_B30.TIF", "L71105041_04120001228_B40.TIF","L71105041_04120001228_B50.TIF","L72105041_04120001228_B70.TIF")) B <- stack("L72105041_04120001228_B80.TIF") Crop <- c(485700,491000,3011000,3016000) img<- crop(A,Crop) pan<- crop(B,Crop) library(RStoolbox) library(raster) library(gridExtra) RGBpan <- panSharpen(img,pan,r=3,g=2,b=1,method="brovey") grid.arrange( ggRGB(img,r=3,g=2,b=1,stretch = "lin"), ggR(pan, stretch = "lin"), ggRGB(RGBpan,stretch="lin"), ncol=3 )
|
1 2 3 4 5 6
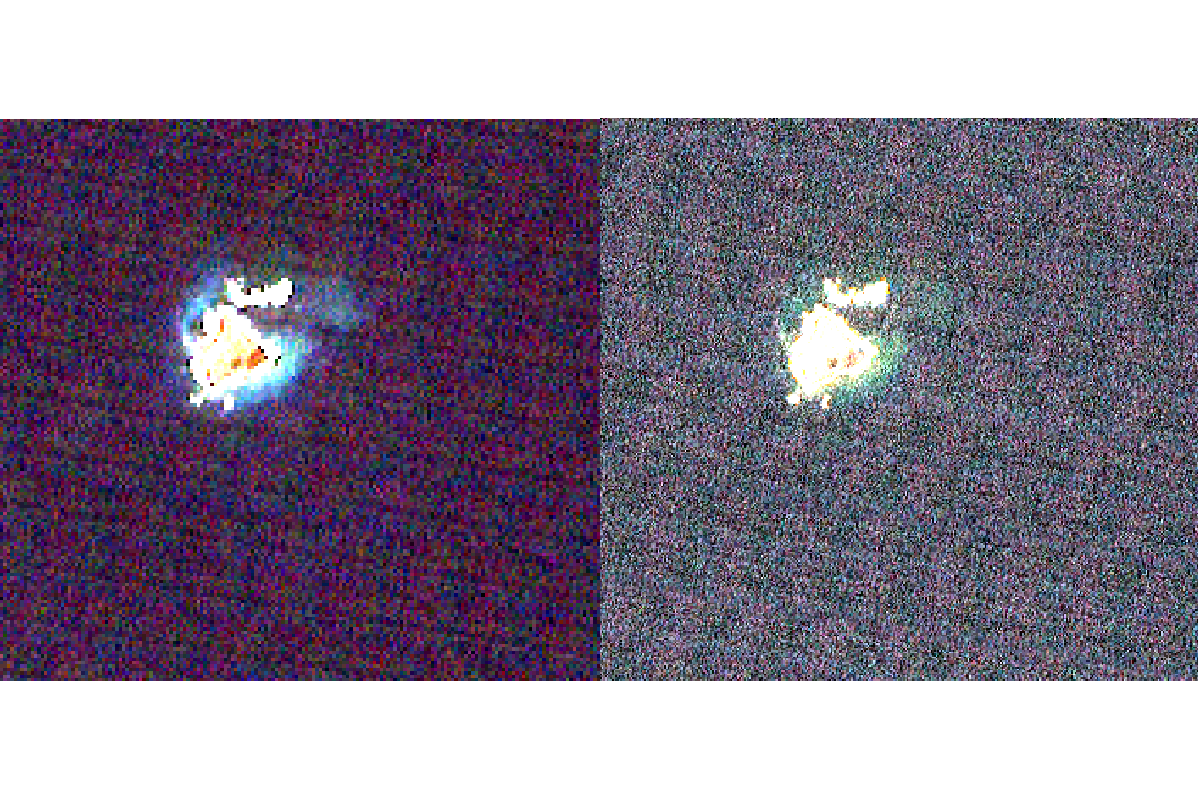
| par(mfrow=c(1,2)) plotRGB(img,3,2,1,stretch = "lin") plotRGB(RGBpan,3,2,1,stretch="lin") par(mfrow=c(1,1))
|
Landsat-8
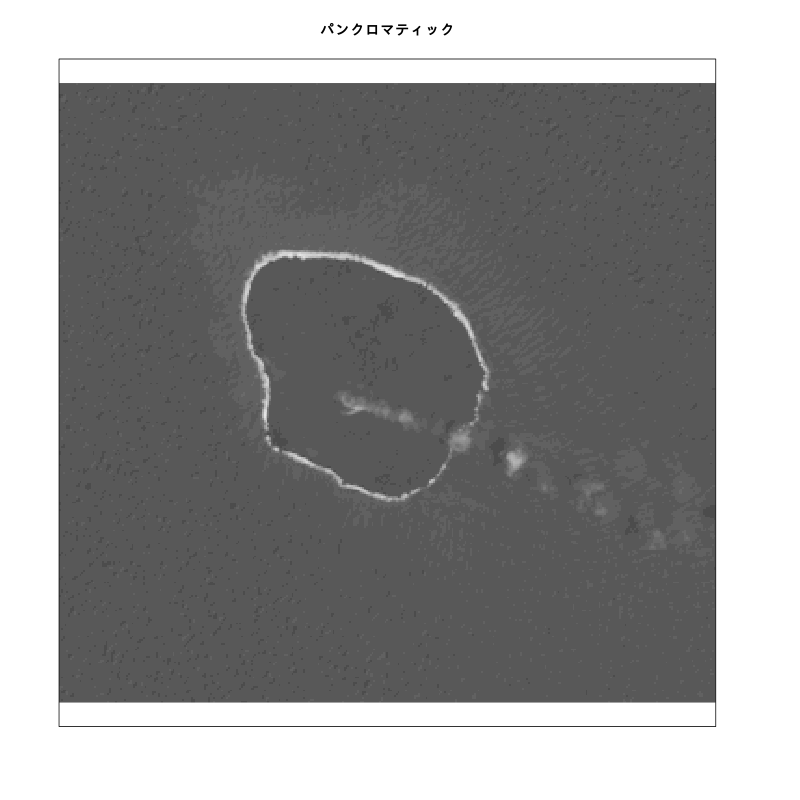
西之島 path:105 row:41 Date:2015-08-24T01:05:37Z
今回は、この関数は読み込む必要なし。
1 2 3 4 5 6 7 8 9 10 11 12 13
| read.meta<- function(product){ meta.file <- paste0(product, "/", product, "_MTL.txt") textLines <- readLines(meta.file) met <- read.table(text=textLines[grep("=", textLines)],header = FALSE, sep = "=", strip.white = TRUE, stringsAsFactors = FALSE,row.names = NULL, col.names = c("name", "value")) met <- met[!met$name == "GROUP", ] met <- met[!met$name == "END_GROUP", ] rownames(met) <- tolower(met[, "name"]) met[, "name"] <- NULL met <- as.list(as.data.frame(t(met), stringsAsFactors = FALSE)) return(met) }
|
データは/home/user/R/work/landsat8/LC81050412015236LGN00 へ
1 2 3 4 5 6 7 8 9 10 11 12 13 14 15 16 17 18 19 20 21 22 23 24 25 26
| library(raster) library(colorRamps) setwd("/home/user/R/work/landsat8") product <- "LC81050412015236LGN00" Crop <- c(485700,491000,3011000,3016000) OLI<-stack(c(aerosol=paste0(product,"/",product, "_B1.TIF"),blue=paste0(product,"/",product, "_B2.TIF"), green=paste0(product,"/",product, "_B3.TIF"),red=paste0(product,"/",product, "_B4.TIF"), nir=paste0(product,"/",product, "_B5.TIF"),swir1=paste0(product,"/",product, "_B6.TIF"), swir2=paste0(product,"/",product, "_B7.TIF"),cirrus=paste0(product,"/",product, "_B9.TIF"))) PAN <-stack(paste0(product,"/",product, "_B8.TIF")) names(PAN)<-"panchromatic" TIRS<-stack(c(tirs1=paste0(product,"/",product, "_B10.TIF"),tirs2=paste0(product,"/",product, "_B11.TIF"))) subOLI <- crop(OLI,Crop) subPAN <- crop(PAN,Crop) subTIRS <- crop(TIRS,Crop) plot(subPAN, col = gray.colors(30), legend=FALSE, axes=FALSE,main="パンクロマティック")
|
1 2 3
| library(RStoolbox) RGBpan <- panSharpen(subOLI ,subPAN,r=4,g=3,b=2,method="brovey") RGBpan
|
class : RasterBrick
dimensions : 333, 353, 117549, 3 (nrow, ncol, ncell, nlayers)
resolution : 15, 15 (x, y)
extent : 485707.5, 491002.5, 3011002, 3015998 (xmin, xmax, ymin, ymax)
coord. ref. : +proj=utm +zone=54 +datum=WGS84 +units=m +no_defs +ellps=WGS84 +towgs84=0,0,0
data source : in memory
names : blue_pan, green_pan, red_pan
min values : 2501.170, 2231.201, 2019.180
max values : 12579.91, 11540.07, 11596.08
1 2 3 4 5 6
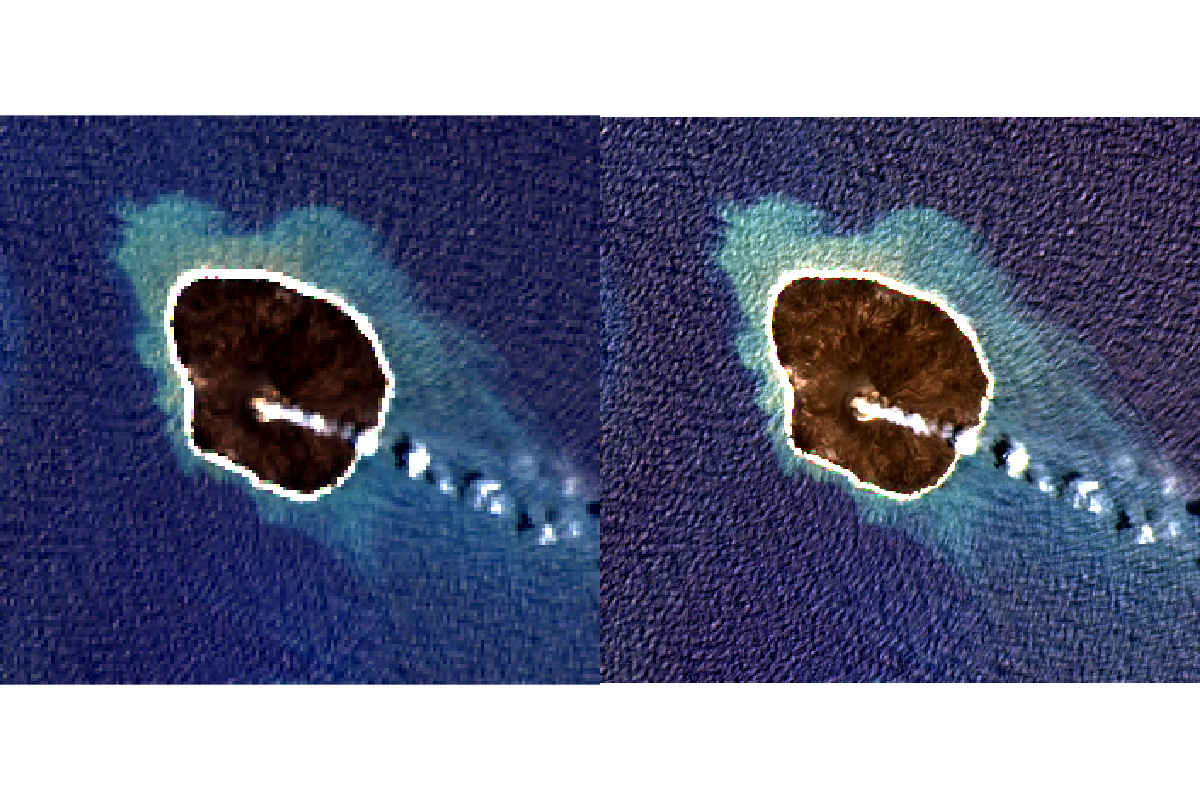
| par(mfrow=c(1,2)) plotRGB(subOLI,4,3,2,stretch = "lin") plotRGB(RGBpan,3,2,1,stretch="lin") par(mfrow=c(1,1))
|
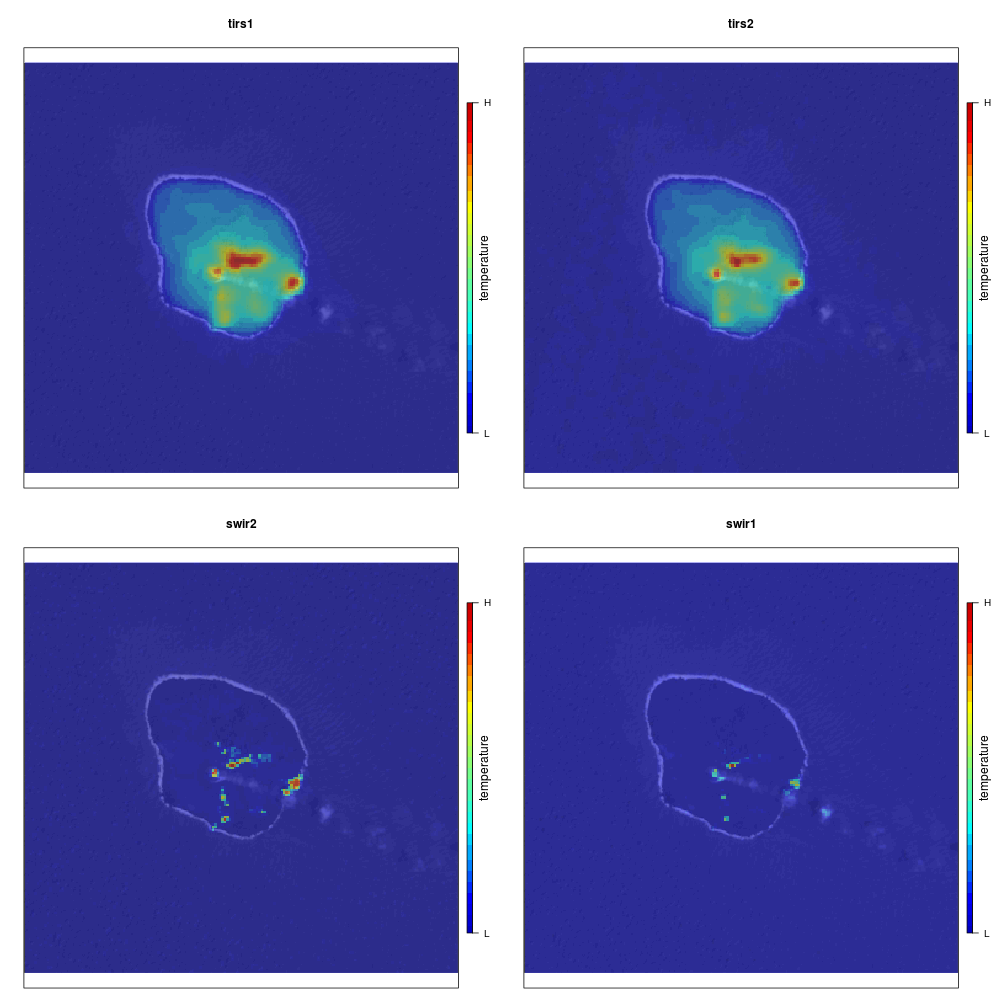
パンクロマティックを下敷きに重ね書き
1 2 3 4 5 6 7 8 9 10 11 12 13 14 15 16
| temp<-brick(subTIRS[[1]],subTIRS[[2]],subOLI[[7]],subOLI[[6]]) #png("pansharpen05.png",width=1000,height=1000) par(mfrow=c(2,2),mar = c(1, 2, 4, 2)) for (i in 1:4) { plot(subPAN, col = gray.colors(30), legend=FALSE, axes=FALSE,main=names(temp[[i]])) plot(temp[[i]],col=blue2green2red(30), legend=FALSE, axes=FALSE,alpha=0.5,add=T) r.range <- c(minValue(temp[[i]]), maxValue(temp[[i]])) plot(temp[[i]], legend.only=TRUE, col=blue2green2red(30), legend.width=1, legend.shrink=0.75, axis.args=list(at=c(r.range[1], r.range[2]), labels=c("L","H"), cex.axis=1), legend.args=list(text='temperature', side=4, font=1, line=0.5, cex=1)) } par(mfrow=c(1,1)) #dev.off()
|
1 2
| RGBpan <- panSharpen(temp,subPAN,r=2,g=3,b=4,method="brovey") RGBpan
|
class : RasterBrick
dimensions : 333, 353, 117549, 3 (nrow, ncol, ncell, nlayers)
resolution : 15, 15 (x, y)
extent : 485707.5, 491002.5, 3011002, 3015998 (xmin, xmax, ymin, ymax)
coord. ref. : +proj=utm +zone=54 +datum=WGS84 +units=m +no_defs +ellps=WGS84 +towgs84=0,0,0
data source : in memory
names : tirs2_pan, swir2_pan, swir1_pan
min values : 1819.3191, 967.8624, 828.2973
max values : 21873.456, 8925.347, 7828.823
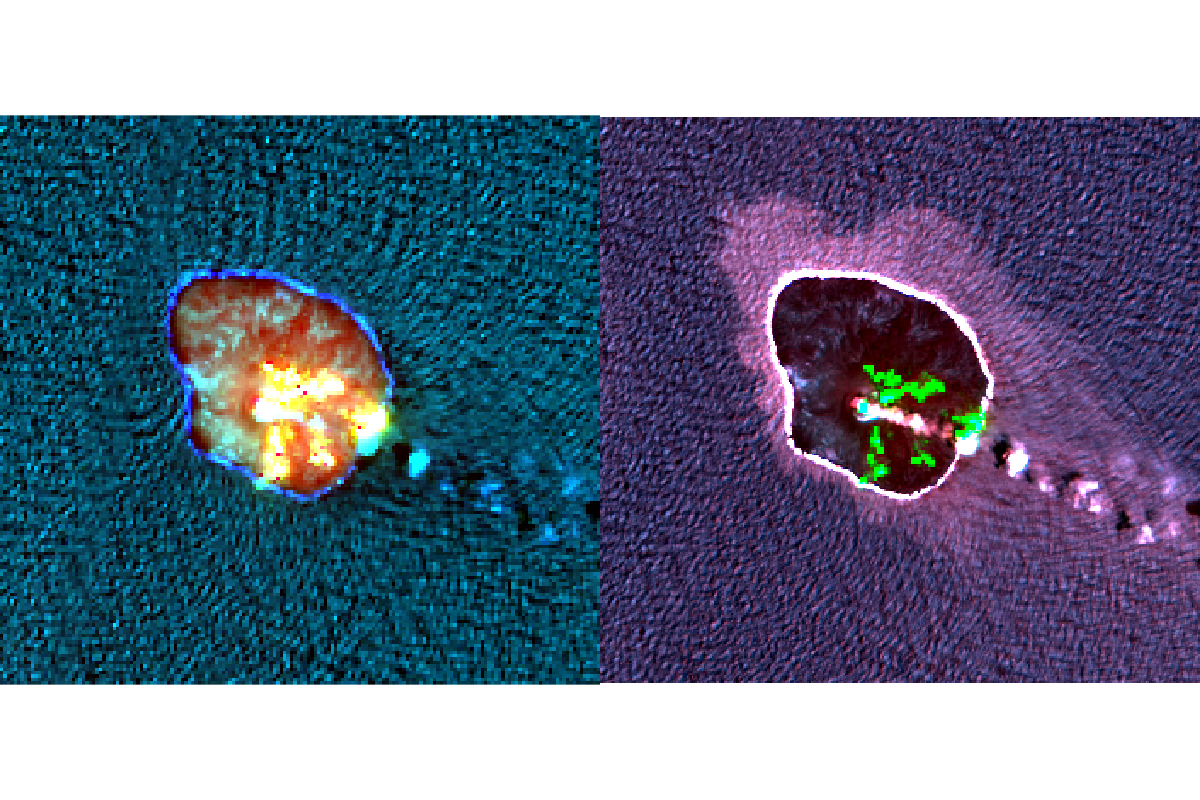
1 2 3 4 5 6 7
| par(mfrow=c(1,2)) plotRGB(temp,2,3,4,stretch="lin") plotRGB(RGBpan,1,2,3,stretch="lin") par(mfrow=c(1,1))
|
1 2 3 4 5 6 7 8 9 10
| par(mfrow=c(1,2)) temp<-brick(subOLI[[7]],subOLI[[5]]-subOLI[[6]],subTIRS[[2]]) RGBpan <- panSharpen(temp,subPAN,r=1,g=2,b=3,method="brovey") RGBpan plotRGB(RGBpan,1,2,3,stretch="lin") RGBpan <- panSharpen(temp,subPAN,r=1,g=2,b=3,method="ihs") RGBpan plotRGB(RGBpan,1,2,3,stretch="lin")
|
method=”brovey”
class : RasterBrick
dimensions : 333, 353, 117549, 3 (nrow, ncol, ncell, nlayers)
resolution : 15, 15 (x, y)
extent : 485707.5, 491002.5, 3011002, 3015998 (xmin, xmax, ymin, ymax)
coord. ref. : +proj=utm +zone=54 +datum=WGS84 +units=m +no_defs +ellps=WGS84 +towgs84=0,0,0
data source : in memory
names : swir2_pan, layer_pan, tirs2_pan
min values : 1109.156, -3894.012, 3082.163
max values : 12201.97, 12617.71, 20296.91
method=”ihs”
class : RasterBrick
dimensions : 333, 353, 117549, 3 (nrow, ncol, ncell, nlayers)
resolution : 15, 15 (x, y)
extent : 485707.5, 491002.5, 3011002, 3015998 (xmin, xmax, ymin, ymax)
coord. ref. : +proj=utm +zone=54 +datum=WGS84 +units=m +no_defs +ellps=WGS84 +towgs84=0,0,0
data source : in memory
names : swir2_pan, layer_pan, tirs2_pan
min values : 3070.52, -41392.57, 14583.00
max values : 51729.43, 29823.67, 37736.17
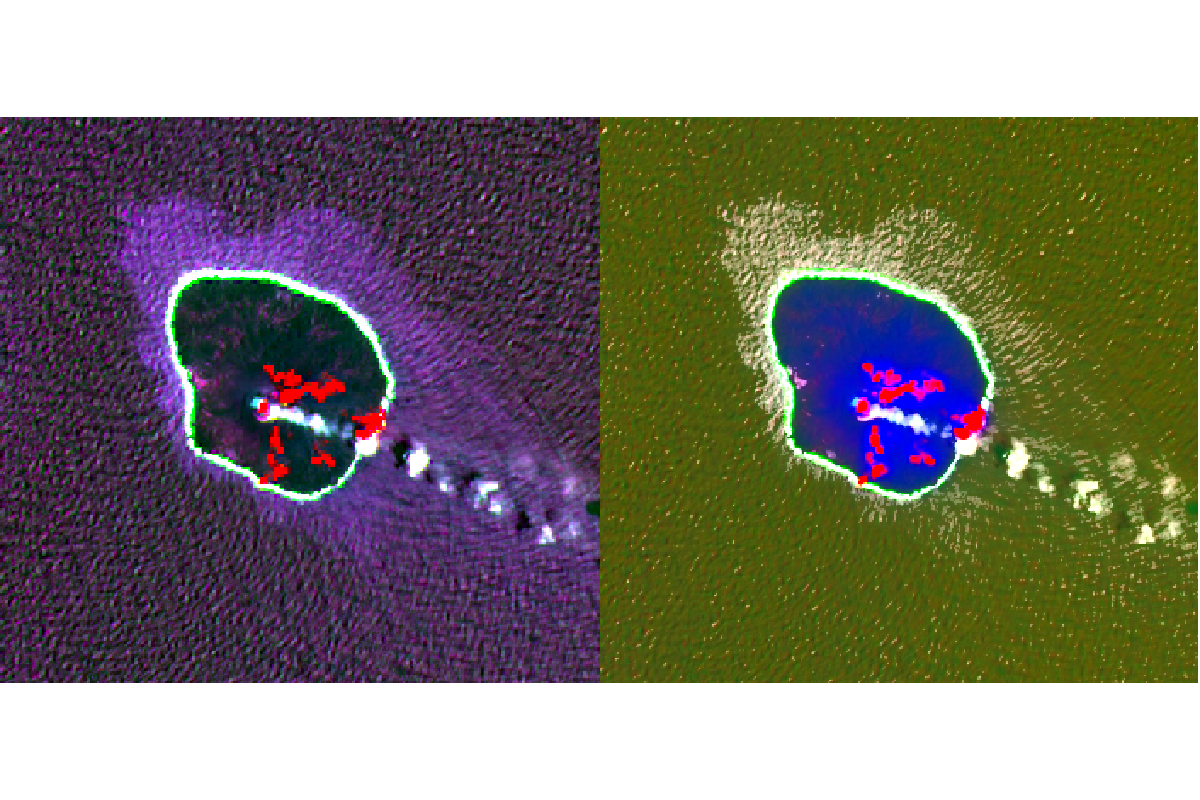
- 左:method=”brovey” 右:method = “ihs”
追記
記事ランドサット8号のデータ3
の可視光の画像をpanSharpen関数を使って処理した画像を載っけておきます。
コードの前半部は記事[ランドサット8号のデータ3]と同じ
1 2 3 4 5 6 7
| library(RStoolbox) library(raster) library(gridExtra) RGBpan <- panSharpen(subOLI,subPAN, r = 4, g = 3, b = 2, method = "brovey")
|
method = “brovey”
class : RasterBrick
dimensions : 573, 666, 381618, 3 (nrow, ncol, ncell, nlayers)
resolution : 15, 15 (x, y)
extent : 420007.5, 429997.5, 3926002, 3934598 (xmin, xmax, ymin, ymax)
coord. ref. : +proj=utm +zone=53 +datum=WGS84 +units=m +no_defs +ellps=WGS84 +towgs84=0,0,0
data source : in memory
names : blue_pan, green_pan, red_pan
min values : 2619.071, 2475.423, 2129.057
max values : 13156.09, 10957.79, 12615.13
1 2 3 4 5 6
| par(mfrow=c(1,2)) plotRGB(subOLI, r = 4, g = 3, b = 2, stretch = "lin") plotRGB(RGBpan,r = 3, g = 2, b = 1,stretch="lin") par(mfrow=c(1,1))
|
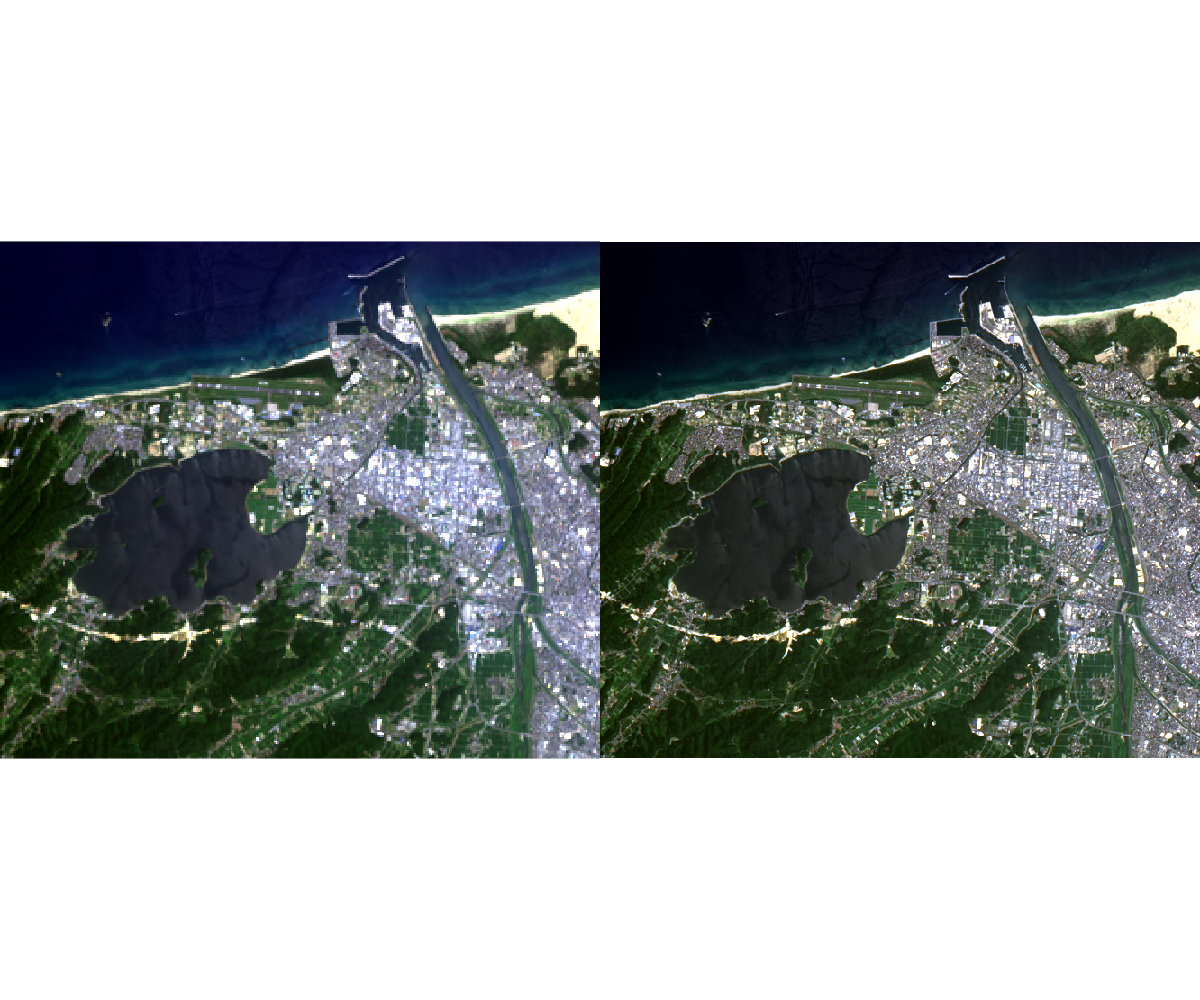
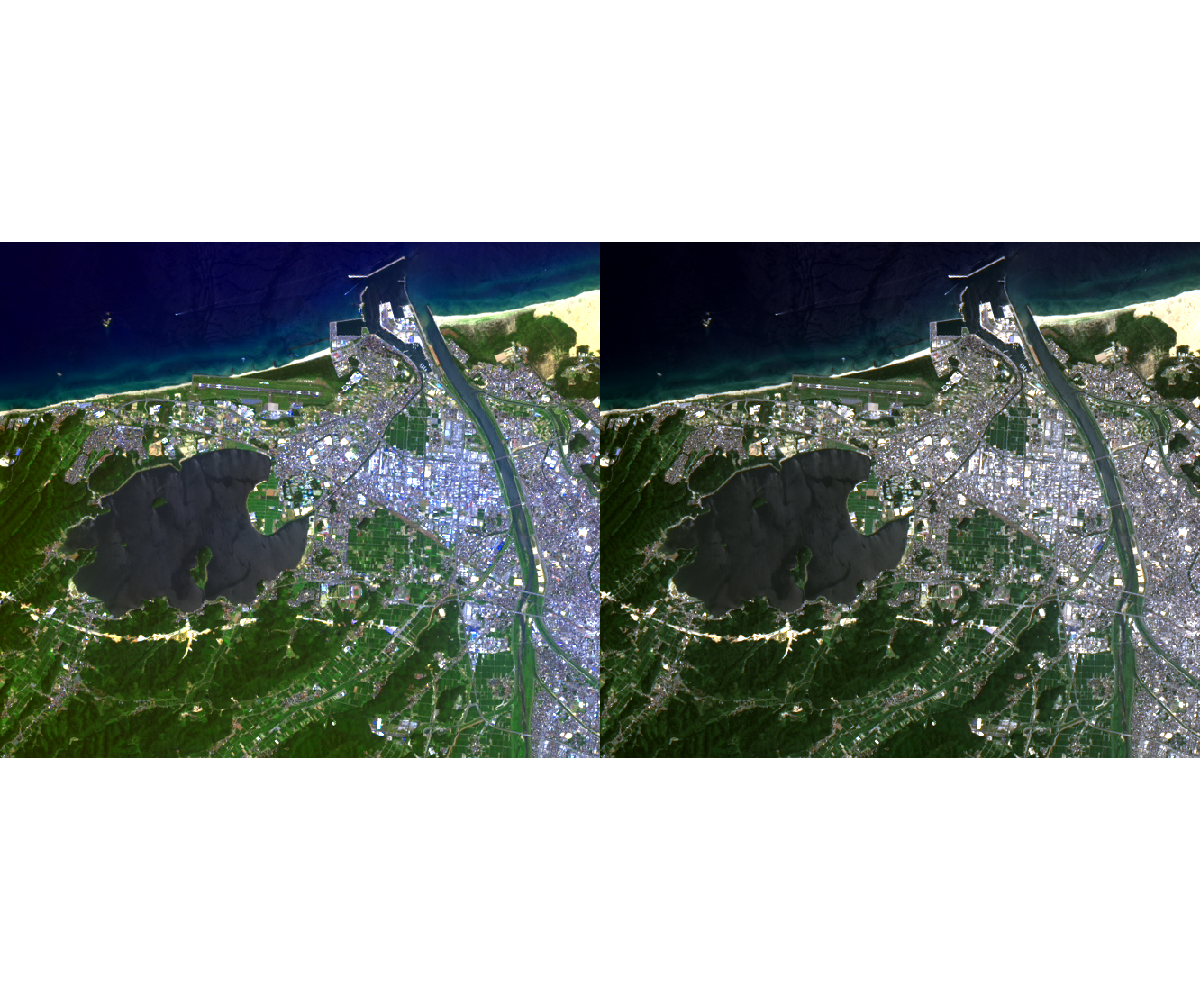
- 左:処理なし 右:method = “brovey”
1 2 3 4 5 6 7 8
| par(mfrow=c(1,2)) RGBpan <- panSharpen(subOLI[[2:4]],subPAN, method = "pca") plotRGB(RGBpan,r = 3, g = 2, b = 1,stretch="lin") RGBpan <- panSharpen(subOLI,subPAN, r = 4, g = 3, b = 2, ) plotRGB(RGBpan,r = 3, g = 2, b = 1,stretch="lin") par(mfrow=c(1,1))
|
method = “pca”
class : RasterBrick
dimensions : 573, 666, 381618, 3 (nrow, ncol, ncell, nlayers)
resolution : 15, 15 (x, y)
extent : 420007.5, 429997.5, 3926002, 3934598 (xmin, xmax, ymin, ymax)
coord. ref. : +proj=utm +zone=53 +datum=WGS84 +units=m +no_defs +ellps=WGS84 +towgs84=0,0,0
data source : in memory
names : blue_pan, green_pan, red_pan
min values : -1.819482, -1.535279, -1.619051
max values : 15.90116, 11.70955, 12.47470
method = “ihs”
class : RasterBrick
dimensions : 573, 666, 381618, 3 (nrow, ncol, ncell, nlayers)
resolution : 15, 15 (x, y)
extent : 420007.5, 429997.5, 3926002, 3934598 (xmin, xmax, ymin, ymax)
coord. ref. : +proj=utm +zone=53 +datum=WGS84 +units=m +no_defs +ellps=WGS84 +towgs84=0,0,0
data source : in memory
names : blue_pan, green_pan, red_pan
min values : 6876.000, 8012.833, 9068.296
max values : 26365.00, 23610.00, 25356.67
- 左:method = “pca” 右:method = “ihs”