climatol パッケージの rosavent 関数
(データ)
気象庁 過去の気象データ検索
(データ使用に関する注意事項)
気象庁ホームページについて
(パッケージもしくは関数の入手は)
CLIMATOL
「Warning! The package at CRAN repositories is unusable with recent versions of R!!! 」という警告あり
- R2.13.0ではCRANを通してインストールできる
- 新しいバージョンのRの場合、パッケージをダウンロードしてインストールするか。関数をダウンロードしてsource関数で取り込む。
この記事では以下のようなコードでHPから直接取り込みます。
source(“http://www.meteobal.com/climatol/rosavent.R“)
climatol パッケージのサンプルデータ windfr の書式を見てみると、
data(windfr)
library(xtable)
print(xtable(windfr),”html”)
| N | NNE | NE | ENE | E | ESE | SE | SSE | S | SSW | SW | WSW | W | WNW | NW | NNW | |
|---|---|---|---|---|---|---|---|---|---|---|---|---|---|---|---|---|
| 0-3 | 59 | 48 | 75 | 90 | 71 | 15 | 10 | 11 | 14 | 20 | 22 | 22 | 24 | 15 | 19 | 33 |
| 3-6 | 3 | 6 | 29 | 42 | 11 | 3 | 4 | 3 | 9 | 50 | 67 | 28 | 14 | 13 | 15 | 5 |
| 6-9 | 1 | 3 | 16 | 17 | 2 | 0 | 0 | 0 | 2 | 16 | 33 | 17 | 6 | 5 | 9 | 2 |
| > 9 | 0 | 1 | 2 | 3 | 0 | 0 | 0 | 0 | 0 | 1 | 4 | 3 | 1 | 1 | 2 | 0 |
やること
- 気象庁のHPから鳥取市の気象データを入手し、 XML パッケージを利用してデータフレーム化。
- グラフを描く
風向きと風速はrosavent関数が扱える書式に合うように整形する必要あり。
気象庁のHPの2015年1月1日の鳥取市のデータをXMLパッケージを使って加工
この記事では1日分のデータですが、例えば for文 + rbind 関数を使うと1月分とか1年分(複数年分)のデータの取り込みも可です。
もちろん観測地点のコードを変えると他の観測地のデータも取り込めます。
|
|
| date | time | pressure | precipitation | temperature | wind_velocity | wind_direction |
|---|---|---|---|---|---|---|
| 2015/1/1:24 | Min. : 1.00 | Min. :1008 | Min. :0.000 | Min. :-1.3000 | Min. : 2.700 | 西南西 :7 |
| 1st Qu.: 6.75 | 1st Qu.:1009 | 1st Qu.:0.000 | 1st Qu.:-0.0250 | 1st Qu.: 3.950 | 西 :5 | |
| Median :12.50 | Median :1009 | Median :0.500 | Median : 0.6000 | Median : 5.300 | 北西 :4 | |
| Mean :12.50 | Mean :1011 | Mean :1.478 | Mean : 0.7333 | Mean : 5.417 | 北北西 :3 | |
| 3rd Qu.:18.25 | 3rd Qu.:1013 | 3rd Qu.:1.750 | 3rd Qu.: 1.3750 | 3rd Qu.: 7.075 | 西北西 :2 | |
| Max. :24.00 | Max. :1016 | Max. :8.500 | Max. : 2.7000 | Max. :10.100 | 東南東 :1 | |
| NA’s :1 | (Other):2 |
[1] “西” “西南西” “西北西” “東南東” “南西” “南南西” “北西” “北北西”
何度も気象庁のHPにアクセスするのを控えるために作成したデータセットを保存する。
|
|
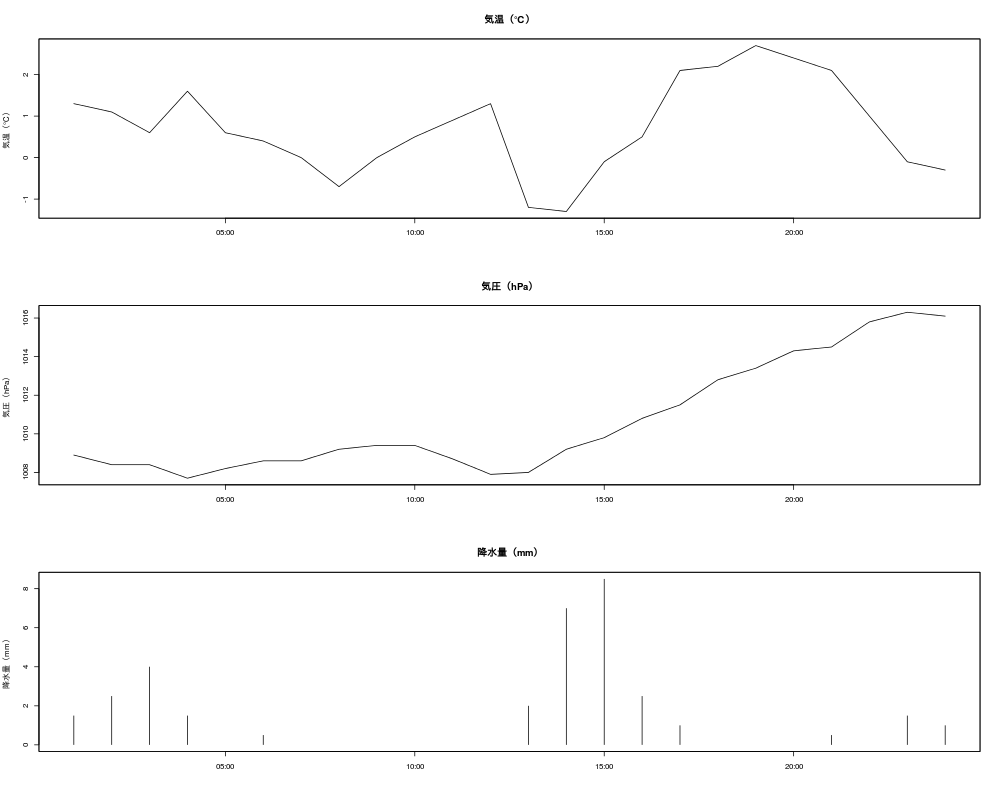
グラフを描きます。
まず、気温、気圧、降水量
|
|
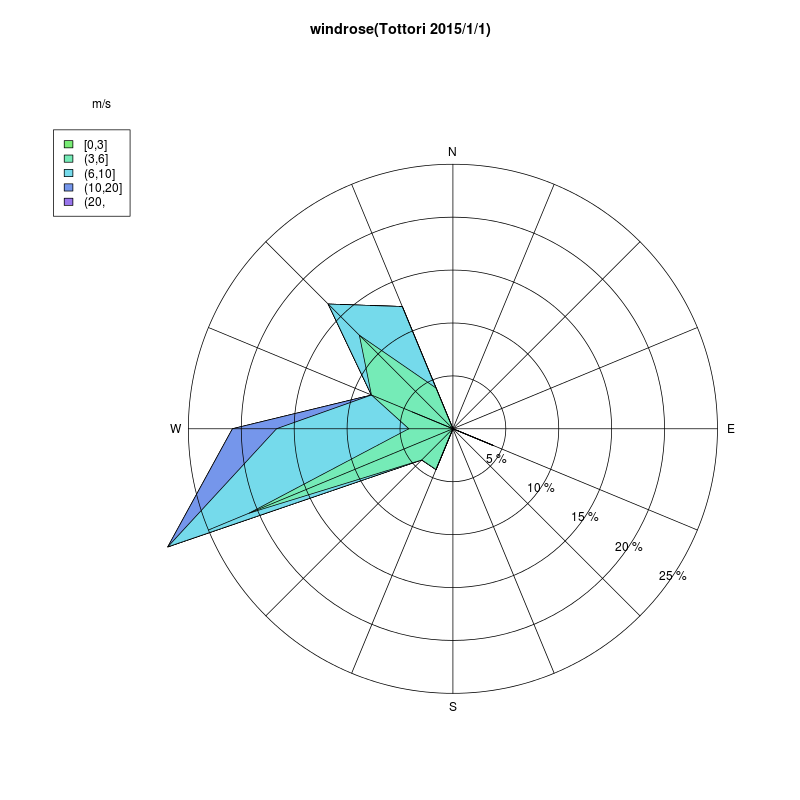
風向き、風速
|
|
| N | NNE | NE | ENE | E | ESE | SE | SSE | S | SSW | SW | WSW | W | WNW | NW | NNW | |
|---|---|---|---|---|---|---|---|---|---|---|---|---|---|---|---|---|
| [0,3] | 0 | 0 | 0 | 0 | 0 | 0 | 0 | 0 | 0 | 1 | 0 | 0 | 0 | 1 | 0 | 0 |
| (3,6] | 0 | 0 | 0 | 0 | 0 | 1 | 0 | 0 | 0 | 0 | 1 | 5 | 1 | 1 | 3 | 1 |
| (6,10] | 0 | 0 | 0 | 0 | 0 | 0 | 0 | 0 | 0 | 0 | 0 | 2 | 3 | 0 | 1 | 2 |
| (10,20] | 0 | 0 | 0 | 0 | 0 | 0 | 0 | 0 | 0 | 0 | 0 | 0 | 1 | 0 | 0 | 0 |
| (20, | 0 | 0 | 0 | 0 | 0 | 0 | 0 | 0 | 0 | 0 | 0 | 0 | 0 | 0 | 0 | 0 |
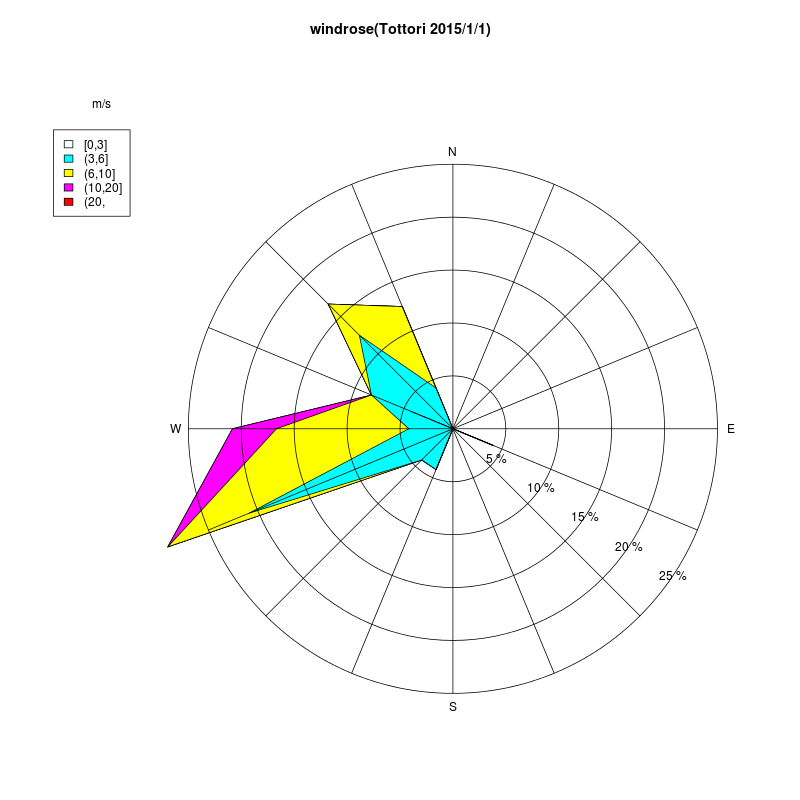
色を変更
|
|
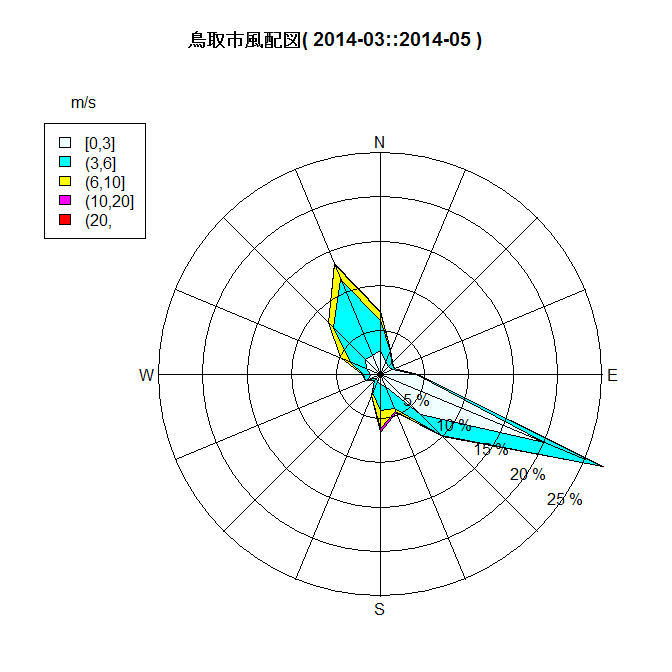
R+XMLパッケージを使って鳥取市の2000年から2015年4月までの気象データを入手し、加工。
|
|
グラフは省略
|
|
| N | NNE | NE | ENE | E | ESE | SE | SSE | S | SSW | SW | WSW | W | WNW | NW | NNW | |
|---|---|---|---|---|---|---|---|---|---|---|---|---|---|---|---|---|
| [0,3] | 55 | 33 | 27 | 31 | 84 | 416 | 134 | 31 | 24 | 19 | 14 | 31 | 23 | 35 | 48 | 49 |
| (3,6] | 72 | 26 | 11 | 4 | 2 | 149 | 69 | 55 | 60 | 28 | 6 | 6 | 17 | 40 | 109 | 193 |
| (6,10] | 19 | 4 | 3 | 0 | 0 | 1 | 2 | 9 | 43 | 6 | 0 | 0 | 2 | 26 | 16 | 38 |
| (10,20] | 1 | 0 | 0 | 0 | 0 | 0 | 0 | 3 | 10 | 0 | 0 | 0 | 0 | 0 | 0 | 2 |
| (20, | 0 | 0 | 0 | 0 | 0 | 0 | 0 | 0 | 0 | 0 | 0 | 0 | 0 | 0 | 0 | 0 |

| N | NNE | NE | ENE | E | ESE | SE | SSE | S | SSW | SW | WSW | W | WNW | NW | NNW | |
|---|---|---|---|---|---|---|---|---|---|---|---|---|---|---|---|---|
| [0,3] | 102 | 66 | 41 | 49 | 129 | 417 | 177 | 61 | 50 | 35 | 32 | 31 | 45 | 42 | 68 | 108 |
| (3,6] | 52 | 11 | 9 | 8 | 4 | 94 | 69 | 67 | 132 | 49 | 6 | 5 | 16 | 47 | 70 | 186 |
| (6,10] | 0 | 1 | 2 | 1 | 0 | 0 | 3 | 6 | 10 | 5 | 0 | 0 | 0 | 7 | 3 | 2 |
| (10,20] | 0 | 0 | 0 | 0 | 0 | 0 | 0 | 0 | 1 | 0 | 0 | 0 | 0 | 0 | 0 | 0 |
| (20, | 0 | 0 | 0 | 0 | 0 | 0 | 0 | 0 | 0 | 0 | 0 | 0 | 0 | 0 | 0 | 0 |
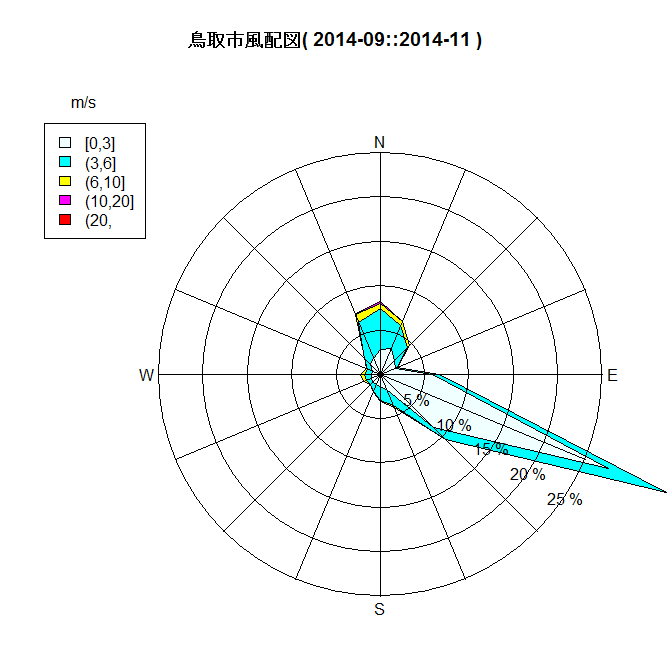
| N | NNE | NE | ENE | E | ESE | SE | SSE | S | SSW | SW | WSW | W | WNW | NW | NNW | |
|---|---|---|---|---|---|---|---|---|---|---|---|---|---|---|---|---|
| [0,3] | 62 | 69 | 48 | 40 | 128 | 606 | 185 | 41 | 30 | 28 | 26 | 23 | 21 | 21 | 34 | 43 |
| (3,6] | 99 | 61 | 45 | 4 | 16 | 154 | 42 | 42 | 33 | 18 | 9 | 14 | 19 | 13 | 22 | 95 |
| (6,10] | 13 | 10 | 8 | 0 | 0 | 0 | 0 | 5 | 4 | 1 | 0 | 7 | 9 | 4 | 1 | 21 |
| (10,20] | 4 | 0 | 0 | 0 | 0 | 0 | 0 | 0 | 0 | 0 | 0 | 0 | 0 | 0 | 0 | 3 |
| (20, | 0 | 0 | 0 | 0 | 0 | 0 | 0 | 0 | 0 | 0 | 0 | 0 | 0 | 0 | 0 | 0 |
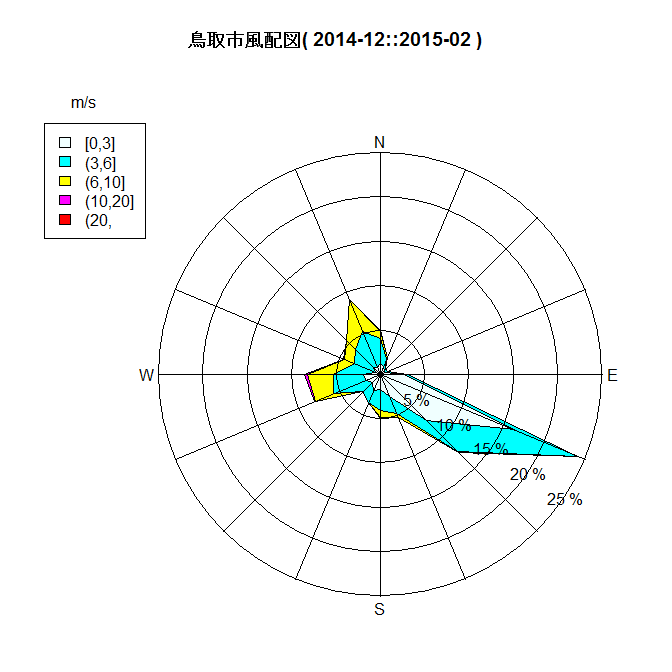
| N | NNE | NE | ENE | E | ESE | SE | SSE | S | SSW | SW | WSW | W | WNW | NW | NNW | |
|---|---|---|---|---|---|---|---|---|---|---|---|---|---|---|---|---|
| [0,3] | 27 | 22 | 14 | 14 | 57 | 352 | 159 | 57 | 36 | 41 | 27 | 37 | 40 | 14 | 23 | 19 |
| (3,6] | 61 | 19 | 5 | 4 | 9 | 166 | 107 | 45 | 51 | 32 | 33 | 87 | 73 | 54 | 61 | 94 |
| (6,10] | 17 | 3 | 0 | 0 | 0 | 0 | 2 | 10 | 18 | 0 | 0 | 46 | 65 | 27 | 32 | 83 |
| (10,20] | 1 | 0 | 0 | 0 | 0 | 0 | 0 | 0 | 1 | 0 | 0 | 4 | 7 | 1 | 0 | 0 |
| (20, | 0 | 0 | 0 | 0 | 0 | 0 | 0 | 0 | 0 | 0 | 0 | 0 | 0 | 0 | 0 | 0 |