島根県鹿島のデータで wind rose
(データ)
気象庁 過去の気象データ検索
(データ使用に関する注意事項)
気象庁ホームページについて
ググっていたら島根県 環境放射線データ リアルタイム表示ってHPを見つけた。
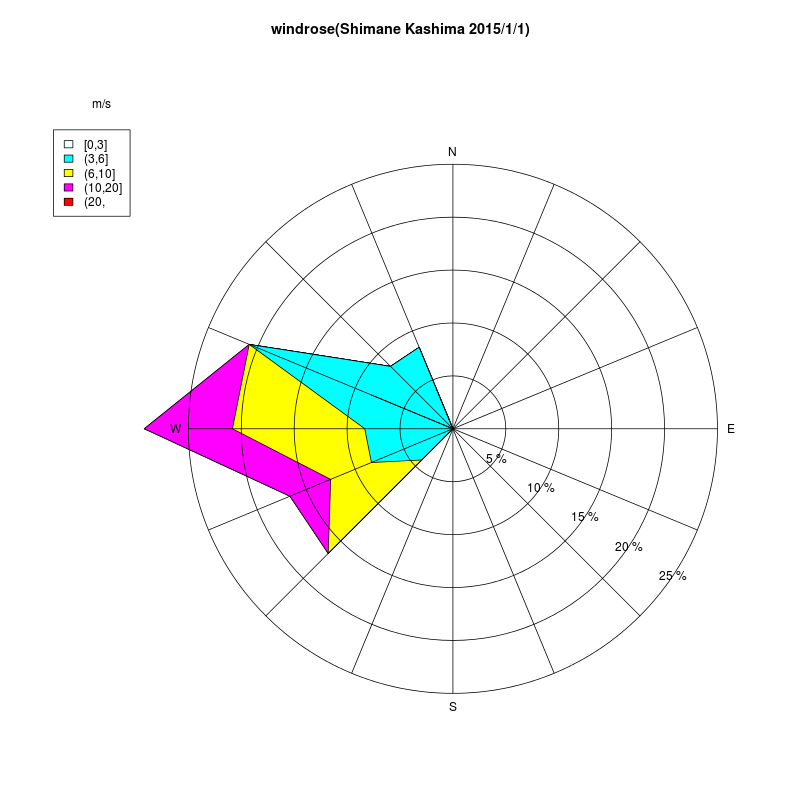
風配図を作ってみる。
(注意する点)
島根県鹿島の気象データは鳥取市と違って、時、降水量、気温、風速、風向、日照時間、降雪積雪
このうち 時、降水量、気温、風速、風向を使ってデータセットを作成。
URLを調べる。
http://www.data.jma.go.jp/obd/stats/etrn/view/hourly_a1.php?prec_no=68&block_no=0693&year=2015&month=1&day=1&view=
鳥取市のURLとは3ヶ所異なる。
hourly_s1.php?prec_no=69&block_no=47746 が
hourly_a1.php?prec_no=68&block_no=0693
気象庁のHPの2015年1月1日の島根県鹿島のデータをXMLパッケージを使って加工
|
|
図は省略
|
|
| N | NNE | NE | ENE | E | ESE | SE | SSE | S | SSW | SW | WSW | W | WNW | NW | NNW | |
|---|---|---|---|---|---|---|---|---|---|---|---|---|---|---|---|---|
| [0,3] | 0 | 0 | 0 | 0 | 0 | 0 | 0 | 0 | 0 | 0 | 0 | 0 | 0 | 2 | 0 | 1 |
| (3,6] | 0 | 0 | 0 | 0 | 0 | 0 | 0 | 0 | 0 | 0 | 1 | 2 | 2 | 3 | 2 | 1 |
| (6,10] | 0 | 0 | 0 | 0 | 0 | 0 | 0 | 0 | 0 | 0 | 3 | 1 | 3 | 0 | 0 | 0 |
| (10,20] | 0 | 0 | 0 | 0 | 0 | 0 | 0 | 0 | 0 | 0 | 0 | 1 | 2 | 0 | 0 | 0 |
| (20, | 0 | 0 | 0 | 0 | 0 | 0 | 0 | 0 | 0 | 0 | 0 | 0 | 0 | 0 | 0 | 0 |

データ取り込みコードを変更(for文を使う)し、2014年のデータを得る。
(コードは省略)
データセット名はt2とする
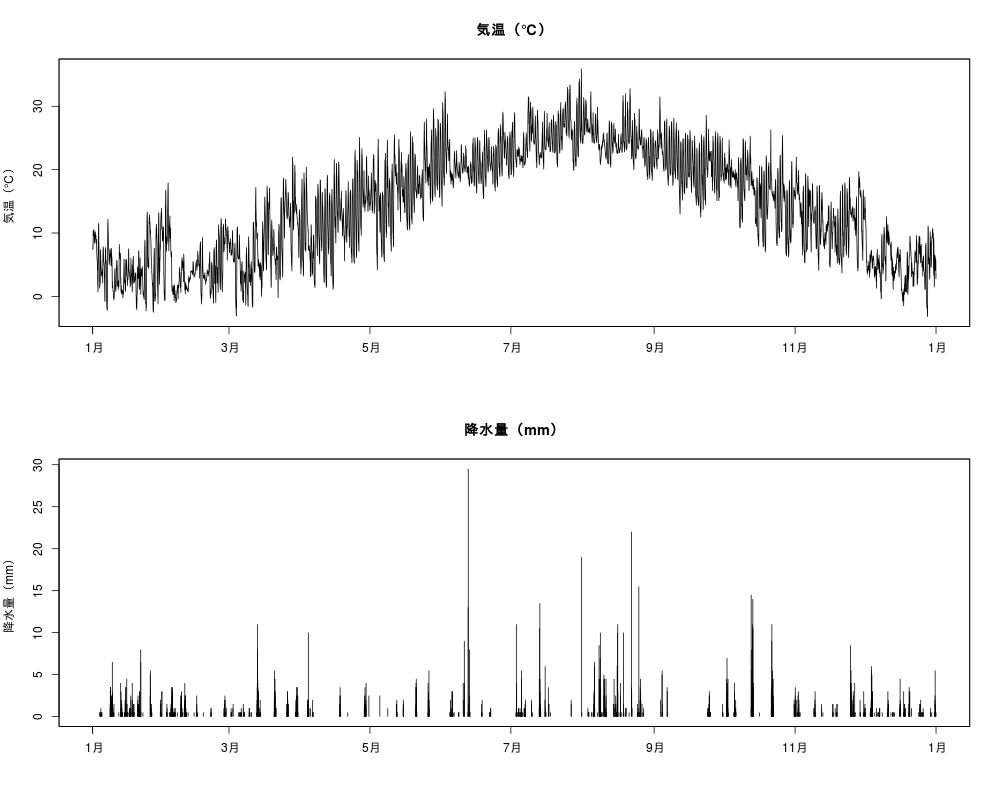
2014年の気温と降水量

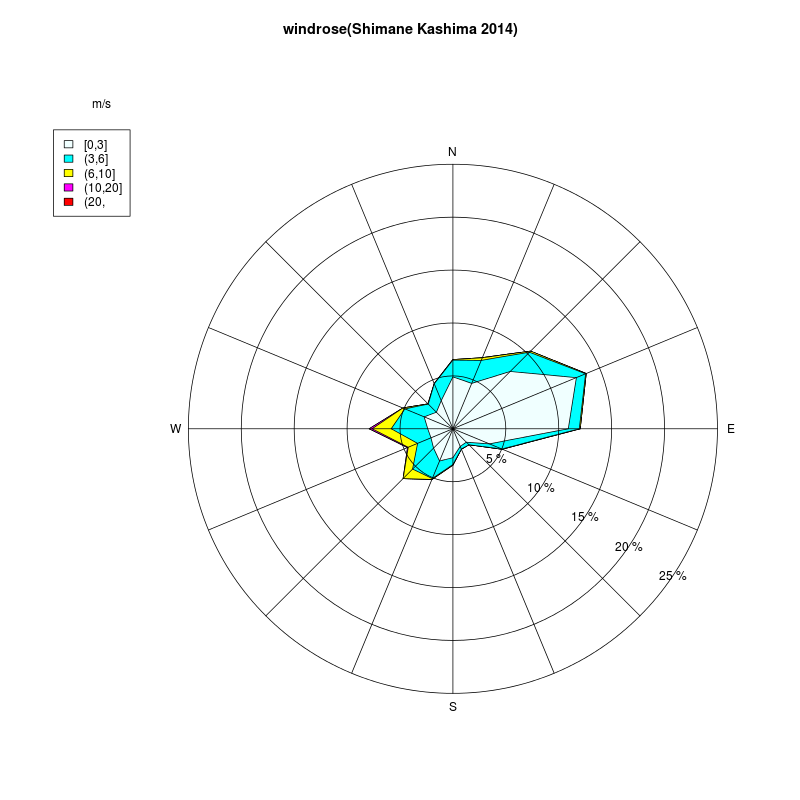
2014年の風の傾向
|
|
| V1 | |
|---|---|
| /// | 2 |
| 西 | 646 |
| 西南西 | 379 |
| 西北西 | 418 |
| 静穏 | 594 |
| 東 | 982 |
| 東南東 | 412 |
| 東北東 | 1113 |
| 南 | 280 |
| 南西 | 543 |
| 南東 | 174 |
| 南南西 | 423 |
| 南南東 | 170 |
| 北 | 534 |
| 北西 | 272 |
| 北東 | 847 |
| 北北西 | 377 |
| 北北東 | 594 |
- 東北東の風が一番多かった。
| N | NNE | NE | ENE | E | ESE | SE | SSE | S | SSW | SW | WSW | W | WNW | NW | NNW | |
|---|---|---|---|---|---|---|---|---|---|---|---|---|---|---|---|---|
| [0,3] | 400 | 379 | 625 | 1031 | 890 | 304 | 146 | 147 | 223 | 269 | 211 | 183 | 194 | 240 | 180 | 235 |
| (3,6] | 130 | 192 | 210 | 77 | 85 | 105 | 28 | 23 | 53 | 147 | 229 | 112 | 282 | 161 | 89 | 141 |
| (6,10] | 4 | 22 | 12 | 5 | 7 | 3 | 0 | 0 | 4 | 7 | 103 | 78 | 147 | 17 | 3 | 1 |
| (10,20] | 0 | 1 | 0 | 0 | 0 | 0 | 0 | 0 | 0 | 0 | 0 | 6 | 23 | 0 | 0 | 0 |
| (20, | 0 | 0 | 0 | 0 | 0 | 0 | 0 | 0 | 0 | 0 | 0 | 0 | 0 | 0 | 0 | 0 |
- 強風は西風が多かった。
wind rose

月ごとの風の傾向を調べる
例えば、1月だと
|
|
のようにして1月分のデータセットを作り、後は上と同様。
for文を使ったコードを書くと一括してできる。
以下、表のみ
kable(windrose01)
| N | NNE | NE | ENE | E | ESE | SE | SSE | S | SSW | SW | WSW | W | WNW | NW | NNW | |
|---|---|---|---|---|---|---|---|---|---|---|---|---|---|---|---|---|
| [0,3] | 19 | 27 | 40 | 68 | 87 | 25 | 20 | 20 | 33 | 28 | 21 | 15 | 15 | 15 | 8 | 17 |
| (3,6] | 14 | 19 | 15 | 1 | 8 | 3 | 0 | 1 | 5 | 23 | 31 | 11 | 29 | 21 | 12 | 16 |
| (6,10] | 0 | 2 | 0 | 0 | 0 | 0 | 0 | 0 | 0 | 1 | 7 | 7 | 16 | 1 | 1 | 0 |
| (10,20] | 0 | 0 | 0 | 0 | 0 | 0 | 0 | 0 | 0 | 0 | 0 | 0 | 0 | 0 | 0 | 0 |
| (20, | 0 | 0 | 0 | 0 | 0 | 0 | 0 | 0 | 0 | 0 | 0 | 0 | 0 | 0 | 0 | 0 |
kable(windrose02)
| N | NNE | NE | ENE | E | ESE | SE | SSE | S | SSW | SW | WSW | W | WNW | NW | NNW | |
|---|---|---|---|---|---|---|---|---|---|---|---|---|---|---|---|---|
| [0,3] | 11 | 30 | 72 | 95 | 56 | 27 | 7 | 2 | 7 | 16 | 11 | 24 | 17 | 16 | 10 | 14 |
| (3,6] | 17 | 66 | 68 | 23 | 8 | 7 | 1 | 0 | 1 | 0 | 2 | 3 | 3 | 0 | 2 | 10 |
| (6,10] | 0 | 8 | 2 | 0 | 0 | 0 | 0 | 0 | 0 | 0 | 4 | 0 | 0 | 0 | 0 | 0 |
| (10,20] | 0 | 0 | 0 | 0 | 0 | 0 | 0 | 0 | 0 | 0 | 0 | 0 | 0 | 0 | 0 | 0 |
| (20, | 0 | 0 | 0 | 0 | 0 | 0 | 0 | 0 | 0 | 0 | 0 | 0 | 0 | 0 | 0 | 0 |
kable(windrose03)
| N | NNE | NE | ENE | E | ESE | SE | SSE | S | SSW | SW | WSW | W | WNW | NW | NNW | |
|---|---|---|---|---|---|---|---|---|---|---|---|---|---|---|---|---|
| [0,3] | 40 | 33 | 47 | 78 | 53 | 26 | 11 | 9 | 18 | 13 | 18 | 10 | 13 | 26 | 28 | 24 |
| (3,6] | 4 | 27 | 9 | 5 | 1 | 6 | 0 | 1 | 1 | 16 | 28 | 16 | 31 | 14 | 27 | 29 |
| (6,10] | 1 | 4 | 2 | 0 | 0 | 0 | 0 | 0 | 0 | 2 | 27 | 10 | 6 | 0 | 0 | 0 |
| (10,20] | 0 | 0 | 0 | 0 | 0 | 0 | 0 | 0 | 0 | 0 | 0 | 0 | 0 | 0 | 0 | 0 |
| (20, | 0 | 0 | 0 | 0 | 0 | 0 | 0 | 0 | 0 | 0 | 0 | 0 | 0 | 0 | 0 | 0 |
kable(windrose04)
| N | NNE | NE | ENE | E | ESE | SE | SSE | S | SSW | SW | WSW | W | WNW | NW | NNW | |
|---|---|---|---|---|---|---|---|---|---|---|---|---|---|---|---|---|
| [0,3] | 51 | 30 | 55 | 119 | 99 | 16 | 13 | 7 | 22 | 17 | 17 | 14 | 9 | 17 | 12 | 21 |
| (3,6] | 19 | 3 | 9 | 4 | 9 | 5 | 8 | 1 | 3 | 11 | 10 | 4 | 15 | 6 | 10 | 17 |
| (6,10] | 0 | 0 | 0 | 0 | 0 | 1 | 0 | 0 | 0 | 0 | 6 | 3 | 8 | 0 | 0 | 0 |
| (10,20] | 0 | 0 | 0 | 0 | 0 | 0 | 0 | 0 | 0 | 0 | 0 | 0 | 0 | 0 | 0 | 0 |
| (20, | 0 | 0 | 0 | 0 | 0 | 0 | 0 | 0 | 0 | 0 | 0 | 0 | 0 | 0 | 0 | 0 |
kable(windrose05)
| N | NNE | NE | ENE | E | ESE | SE | SSE | S | SSW | SW | WSW | W | WNW | NW | NNW | |
|---|---|---|---|---|---|---|---|---|---|---|---|---|---|---|---|---|
| [0,3] | 33 | 19 | 37 | 109 | 79 | 22 | 12 | 12 | 14 | 23 | 12 | 19 | 23 | 18 | 19 | 18 |
| (3,6] | 14 | 5 | 2 | 0 | 9 | 6 | 7 | 8 | 11 | 26 | 35 | 10 | 40 | 17 | 6 | 5 |
| (6,10] | 0 | 0 | 0 | 0 | 0 | 0 | 0 | 0 | 4 | 4 | 17 | 4 | 17 | 0 | 0 | 0 |
| (10,20] | 0 | 0 | 0 | 0 | 0 | 0 | 0 | 0 | 0 | 0 | 0 | 0 | 0 | 0 | 0 | 0 |
| (20, | 0 | 0 | 0 | 0 | 0 | 0 | 0 | 0 | 0 | 0 | 0 | 0 | 0 | 0 | 0 | 0 |
kable(windrose06);
| N | NNE | NE | ENE | E | ESE | SE | SSE | S | SSW | SW | WSW | W | WNW | NW | NNW | |
|---|---|---|---|---|---|---|---|---|---|---|---|---|---|---|---|---|
| [0,3] | 68 | 44 | 62 | 90 | 86 | 33 | 11 | 8 | 12 | 17 | 11 | 9 | 21 | 29 | 13 | 29 |
| (3,6] | 19 | 2 | 2 | 0 | 6 | 16 | 6 | 2 | 2 | 6 | 7 | 3 | 24 | 8 | 1 | 8 |
| (6,10] | 0 | 0 | 0 | 0 | 0 | 0 | 0 | 0 | 0 | 0 | 3 | 0 | 4 | 0 | 0 | 0 |
| (10,20] | 0 | 0 | 0 | 0 | 0 | 0 | 0 | 0 | 0 | 0 | 0 | 0 | 0 | 0 | 0 | 0 |
| (20, | 0 | 0 | 0 | 0 | 0 | 0 | 0 | 0 | 0 | 0 | 0 | 0 | 0 | 0 | 0 | 0 |
kable(windrose07)
| N | NNE | NE | ENE | E | ESE | SE | SSE | S | SSW | SW | WSW | W | WNW | NW | NNW | |
|---|---|---|---|---|---|---|---|---|---|---|---|---|---|---|---|---|
| [0,3] | 43 | 23 | 40 | 72 | 74 | 22 | 9 | 9 | 28 | 33 | 21 | 12 | 19 | 30 | 16 | 32 |
| (3,6] | 9 | 0 | 2 | 1 | 8 | 10 | 0 | 0 | 1 | 12 | 60 | 13 | 25 | 8 | 1 | 15 |
| (6,10] | 0 | 0 | 0 | 0 | 0 | 0 | 0 | 0 | 0 | 0 | 21 | 3 | 0 | 0 | 0 | 0 |
| (10,20] | 0 | 0 | 0 | 0 | 0 | 0 | 0 | 0 | 0 | 0 | 0 | 0 | 0 | 0 | 0 | 0 |
| (20, | 0 | 0 | 0 | 0 | 0 | 0 | 0 | 0 | 0 | 0 | 0 | 0 | 0 | 0 | 0 | 0 |
kable(windrose08)
| N | NNE | NE | ENE | E | ESE | SE | SSE | S | SSW | SW | WSW | W | WNW | NW | NNW | |
|---|---|---|---|---|---|---|---|---|---|---|---|---|---|---|---|---|
| [0,3] | 38 | 31 | 62 | 62 | 59 | 37 | 17 | 17 | 24 | 36 | 34 | 18 | 18 | 27 | 10 | 19 |
| (3,6] | 4 | 3 | 10 | 14 | 20 | 31 | 6 | 5 | 6 | 9 | 11 | 9 | 13 | 5 | 0 | 2 |
| (6,10] | 0 | 0 | 4 | 1 | 7 | 2 | 0 | 0 | 0 | 0 | 0 | 0 | 0 | 0 | 0 | 0 |
| (10,20] | 0 | 0 | 0 | 0 | 0 | 0 | 0 | 0 | 0 | 0 | 0 | 0 | 0 | 0 | 0 | 0 |
| (20, | 0 | 0 | 0 | 0 | 0 | 0 | 0 | 0 | 0 | 0 | 0 | 0 | 0 | 0 | 0 | 0 |
kable(windrose09)
| N | NNE | NE | ENE | E | ESE | SE | SSE | S | SSW | SW | WSW | W | WNW | NW | NNW | |
|---|---|---|---|---|---|---|---|---|---|---|---|---|---|---|---|---|
| [0,3] | 40 | 48 | 76 | 119 | 91 | 34 | 17 | 11 | 12 | 17 | 14 | 15 | 11 | 12 | 12 | 18 |
| (3,6] | 15 | 13 | 16 | 16 | 5 | 9 | 0 | 1 | 4 | 2 | 3 | 0 | 4 | 1 | 1 | 11 |
| (6,10] | 0 | 0 | 0 | 0 | 0 | 0 | 0 | 0 | 0 | 0 | 0 | 0 | 0 | 0 | 0 | 0 |
| (10,20] | 0 | 0 | 0 | 0 | 0 | 0 | 0 | 0 | 0 | 0 | 0 | 0 | 0 | 0 | 0 | 0 |
| (20, | 0 | 0 | 0 | 0 | 0 | 0 | 0 | 0 | 0 | 0 | 0 | 0 | 0 | 0 | 0 | 0 |
kable(windrose10)
| N | NNE | NE | ENE | E | ESE | SE | SSE | S | SSW | SW | WSW | W | WNW | NW | NNW | |
|---|---|---|---|---|---|---|---|---|---|---|---|---|---|---|---|---|
| [0,3] | 40 | 56 | 61 | 106 | 75 | 21 | 6 | 12 | 12 | 15 | 13 | 15 | 19 | 8 | 14 | 21 |
| (3,6] | 13 | 41 | 59 | 9 | 6 | 6 | 0 | 0 | 1 | 0 | 10 | 3 | 4 | 2 | 1 | 15 |
| (6,10] | 3 | 8 | 4 | 4 | 0 | 0 | 0 | 0 | 0 | 0 | 3 | 0 | 0 | 0 | 0 | 0 |
| (10,20] | 0 | 1 | 0 | 0 | 0 | 0 | 0 | 0 | 0 | 0 | 0 | 0 | 0 | 0 | 0 | 0 |
| (20, | 0 | 0 | 0 | 0 | 0 | 0 | 0 | 0 | 0 | 0 | 0 | 0 | 0 | 0 | 0 | 0 |
kable(windrose11)
| N | NNE | NE | ENE | E | ESE | SE | SSE | S | SSW | SW | WSW | W | WNW | NW | NNW | |
|---|---|---|---|---|---|---|---|---|---|---|---|---|---|---|---|---|
| [0,3] | 11 | 28 | 60 | 86 | 79 | 17 | 15 | 19 | 16 | 34 | 20 | 17 | 19 | 21 | 18 | 12 |
| (3,6] | 0 | 10 | 17 | 4 | 5 | 6 | 0 | 0 | 6 | 10 | 11 | 22 | 30 | 17 | 5 | 5 |
| (6,10] | 0 | 0 | 0 | 0 | 0 | 0 | 0 | 0 | 0 | 0 | 2 | 10 | 18 | 5 | 0 | 0 |
| (10,20] | 0 | 0 | 0 | 0 | 0 | 0 | 0 | 0 | 0 | 0 | 0 | 0 | 0 | 0 | 0 | 0 |
| (20, | 0 | 0 | 0 | 0 | 0 | 0 | 0 | 0 | 0 | 0 | 0 | 0 | 0 | 0 | 0 | 0 |
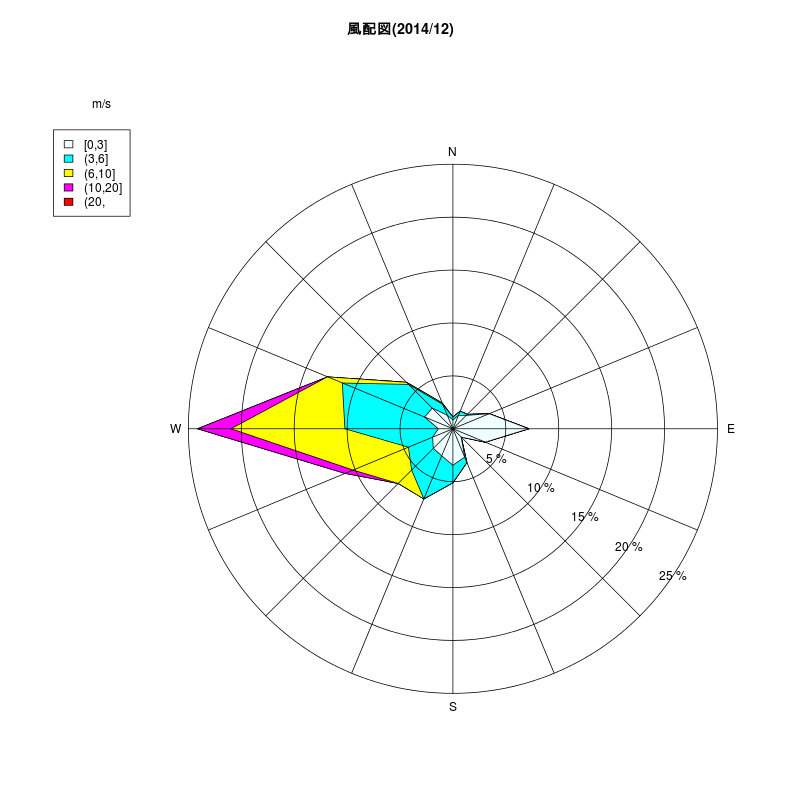
kable(windrose12)
| N | NNE | NE | ENE | E | ESE | SE | SSE | S | SSW | SW | WSW | W | WNW | NW | NNW | |
|---|---|---|---|---|---|---|---|---|---|---|---|---|---|---|---|---|
| [0,3] | 6 | 10 | 13 | 27 | 52 | 24 | 8 | 21 | 25 | 20 | 19 | 15 | 10 | 21 | 20 | 10 |
| (3,6] | 2 | 3 | 1 | 0 | 0 | 0 | 0 | 4 | 12 | 32 | 21 | 18 | 64 | 61 | 23 | 8 |
| (6,10] | 0 | 0 | 0 | 0 | 0 | 0 | 0 | 0 | 0 | 0 | 13 | 41 | 78 | 11 | 2 | 1 |
| (10,20] | 0 | 0 | 0 | 0 | 0 | 0 | 0 | 0 | 0 | 0 | 0 | 6 | 23 | 0 | 0 | 0 |
| (20, | 0 | 0 | 0 | 0 | 0 | 0 | 0 | 0 | 0 | 0 | 0 | 0 | 0 | 0 | 0 | 0 |
例として2014年12月のwind rose
|
|
