震源地と原子力発電所

maps、sp、mapdata パッケージ

震源地のデータ(マグニチュード6以上、1900年から2015-05-04まで)
USGS:米国地質調査所 Search Earthquake Archives
csv形式でダウンロード「eq19000729_20150504.csv」にリネーム。

原発の位置
List of nuclear power stations

表計算ソフトに貼り付け。緯度、経度を10進数に変換。

マッピングした地震規模は M6.9(阪神・淡路大震災 Mj7.3だが USGS[米国地質調査所]のデータではM=6.9)以上

1
2
3
4
5
6
7
8
9
10
11
12
13
14
15
16
17
18
library(sp)
library(maps)
library(mapdata)
#library(maptools)
#library(rgdal)
load("in_service.dat")
load("under_construction.dat")
eq<-read.csv("eq19000729_20150504.csv")
#M6.9(阪神・淡路大震災 Mj7.3だが USGS[米国地質調査所]のデータではM=6.9)以上を抽出
eqdata <- subset(eq, subset=mag>=6.9, select=c(latitude,longitude,depth,mag))
#png("eq6_9.png",width=1000,height=800)
map("world")
points(eqdata$longitude,eqdata$latitude,pch=16,cex =1, col="red")
points(in_service$longitude,in_service$latitude,pch=17,cex =1, col="darkorchid")
points(under_construction$longitude,under_construction$latitude,pch=17,cex =1, col="darkorchid1")
map.axes()
title(main="Earthquake M>=6.9[data:USGS] (1900_2015/5/4) & Nuclear power stations")
#dev.off()

赤い丸が震源地(M6.9以上)、紫とオレンジの三角が原子力発電所。

日本周辺(下の北アメリカの地図に緯度を10,65に合わせて経度の範囲を120度にした)

1
2
3
4
5
6
7
8
9
10
11
12
13
14
15
16
17
18
19
20
21
22
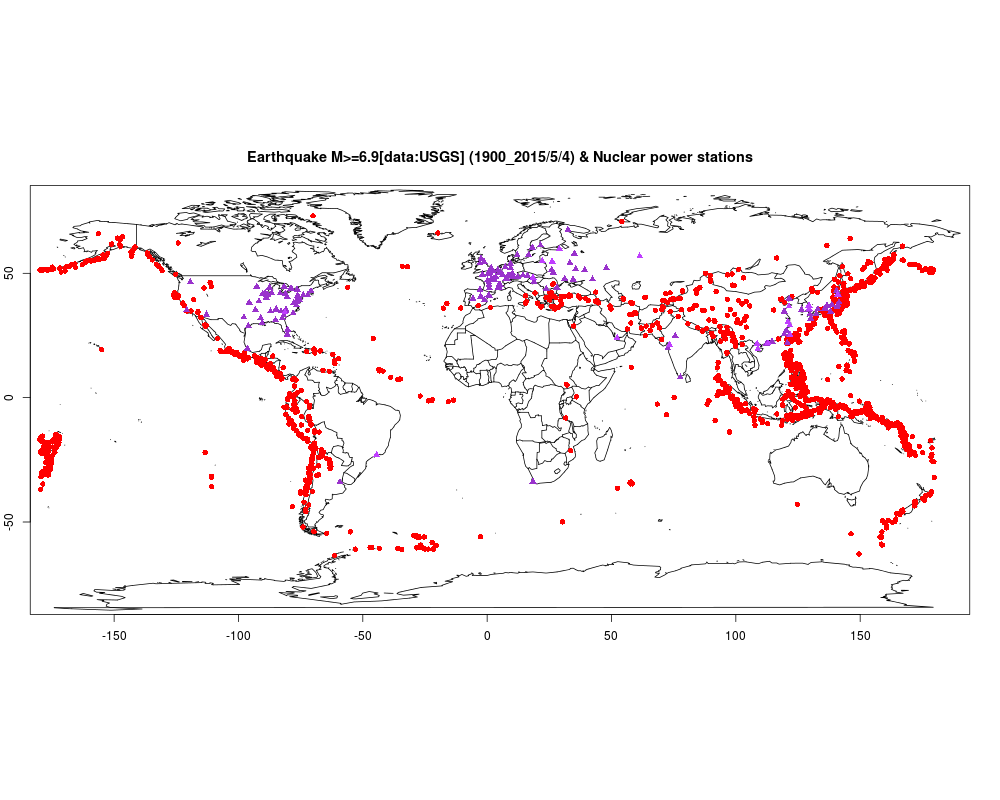
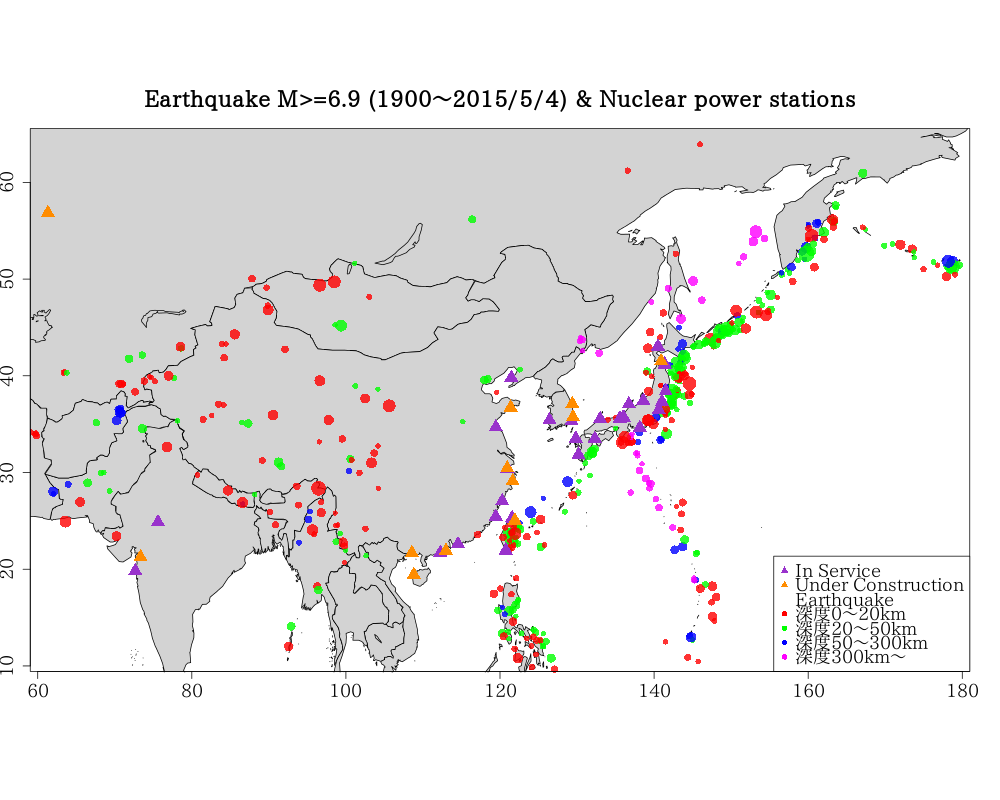
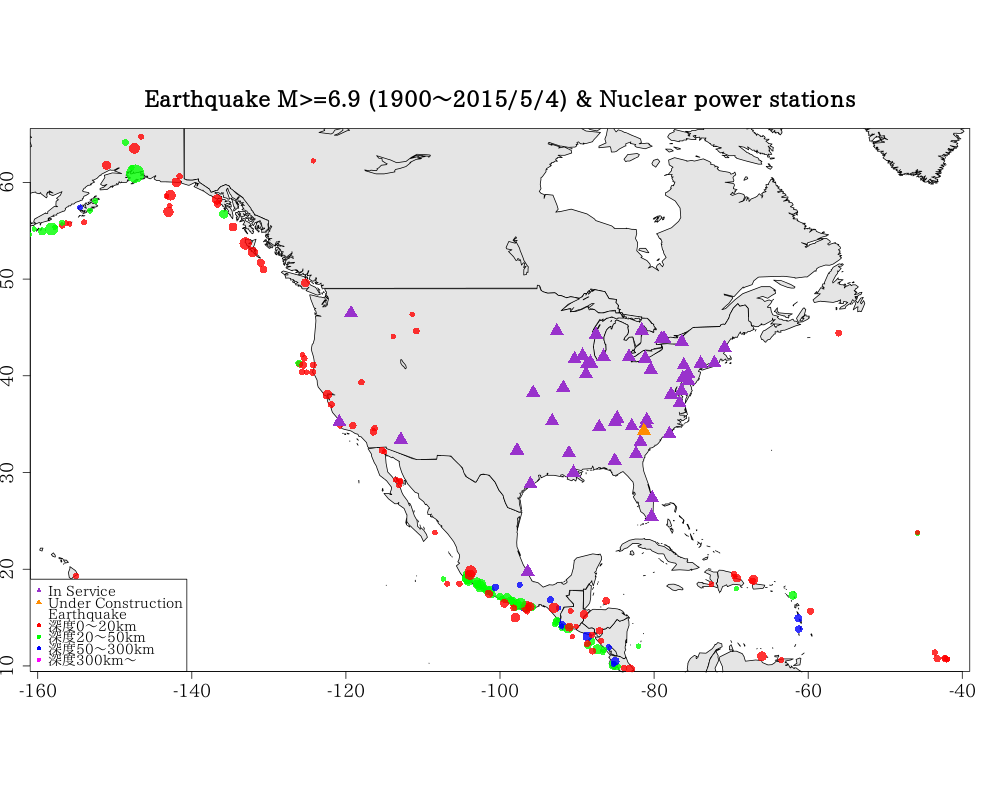
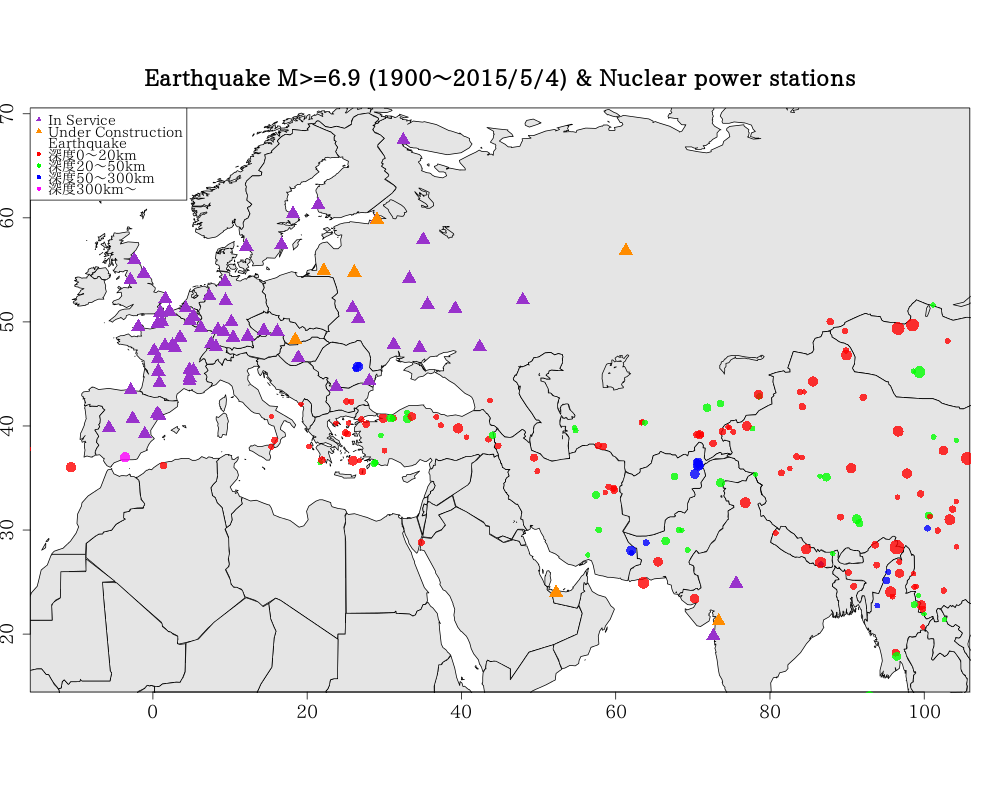
#M6.9(データはUSGSより)以上 大きさに合わせてサイズを変化、深さで色分け(透過色)
for (i in 1:nrow(eqdata)){
if (eqdata$depth[i]<=20) {
eqdata$col[i] <- rgb(1,0,0,0.8)}
if (eqdata$depth[i] > 20 && eqdata$depth <= 50) {
eqdata$col[i] <- rgb(0,1,0,0.8)}
if (eqdata$depth[i] > 50&& eqdata$depth <= 300) {
eqdata$col[i] <- rgb(0,0,1,0.8)}
if (eqdata$depth[i] > 300) {
eqdata$col[i] <- rgb(1,0,1,0.8)}
}
#png("japaneq02.png",width=1000,height=800)
par(family="Takao P明朝",ps = 18)
map('worldHires', xlim=c(60,180), ylim=c(10,65),fill=T,col="lightgray")
points(eqdata$longitude,eqdata$latitude,pch=16,cex =eqdata$mag-5.9, col=eqdata$col)
points(in_service$longitude,in_service$latitude,pch=17,cex =2, col="darkorchid")
points(under_construction$longitude,under_construction$latitude,pch=17,cex =2, col="darkorange")
map.axes()
title(main="Earthquake M>=6.9 (1900~2015/5/4) & Nuclear power stations")
legend("bottomright",legend = c("In Service","Under Construction","Earthquake","深度0~20km","深度20~50km","深度50~300km","深度300km~"),
cex=1,pch=c(17,17,16,16,16,16,16),col=c("darkorchid","darkorange","white",rgb(1,0,0),rgb(0,1,0),rgb(0,0,1),rgb(1,0,1)),bg="white")
#dev.off()

記事「震源地と原子力発電所2」にGMTを用いて範囲を狭く、M>=6.0の地震をプロットした地図あり。

表示する地域を変える

1
2
3
4
5
6
7
8
9
10
11
12
#png("mapeq01.png",width=1000,height=800)
par(family="Takao P明朝",ps = 18)
map("worldHires",xlim=c(-160,-40),ylim=c(10,65),col="gray90",fill=TRUE)
map.axes()
points(eqdata$longitude,eqdata$latitude,pch=16,cex =eqdata$mag-5.9, col=eqdata$col)
points(in_service$longitude,in_service$latitude,pch=17,cex =2, col="darkorchid")
points(under_construction$longitude,under_construction$latitude,pch=17,cex =2, col="darkorange")
#points( -76.725177,40.153259,pch=4,cex=2,col="red") #スリーマイル島
title(main="Earthquake M>=6.9 (1900~2015/5/4) & Nuclear power stations")
legend("bottomleft",legend = c("In Service","Under Construction","Earthquake","深度0~20km","深度20~50km","深度50~300km","深度300km~"),
cex=0.8,pch=c(17,17,rep(16,5)),col=c("darkorchid","darkorange","white",rgb(1,0,0),rgb(0,1,0),rgb(0,0,1),rgb(1,0,1)),bg="white")
#dev.off()

1
2
3
4
5
6
7
8
9
10
11
12
#png("mapeq02.png",width=1000,height=800)
par(family="Takao P明朝",ps = 18)
map("worldHires",xlim=c(-15,105),ylim=c(15,70),col="gray90",fill=TRUE)
map.axes()
points(eqdata$longitude,eqdata$latitude,pch=16,cex =eqdata$mag-5.9, col=eqdata$col)
points(in_service$longitude,in_service$latitude,pch=17,cex =2, col="darkorchid")
points(under_construction$longitude,under_construction$latitude,pch=17,cex =2, col="darkorange")
#points(30.233334,51.25,pch=4,cex=2,col="red") #チェルノブイリ
title(main="Earthquake M>=6.9 (1900~2015/5/4) & Nuclear power stations")
legend("topleft",legend = c("In Service","Under Construction","Earthquake","深度0~20km","深度20~50km","深度50~300km","深度300km~"),
cex=0.8,pch=c(17,17,rep(16,5)),col=c("darkorchid","darkorange","white",rgb(1,0,0),rgb(0,1,0),rgb(0,0,1),rgb(1,0,1)),bg="white")
#dev.off()

1900年から2015年5月4日までに起こったM6.9以上の地震地に近い原子力発電所のランキング

1
2
3
4
5
6
7
8
9
10
11
12
13
14
15
16
17
18
19
20
21
eqloc <-cbind(longitude=eqdata$longitude,latitude=eqdata$latitude)
nuclear1<-in_service[,1:4]
nuclear2<-under_construction[,1:4]
nuclear3<-rbind(nuclear1,nuclear2)
nucloc<-cbind(longitude=nuclear3$longitude,latitude=nuclear3$latitude)
#各原子力発電所と各震源地の距離を計算する
for (i in 1:nrow(eqloc)) {
nuclear3[,(i+4)]<-spDistsN1(nucloc,eqloc[i,],longlat=TRUE)
}
#原子力発電所ごとにもっとも近い震源地との距離を選択
mineq<-data.frame(nuclear3[,1:2])
for (i in 1:nrow(nuclear3)) {
mineq[i,3]<-min(nuclear3[i,5:ncol(nuclear3)])
}
names(mineq)<-c("station","country","distance")
#昇順に並べ替える
sortlist <- order(mineq$distance)
minsort <- mineq[sortlist,]
rownames(minsort) <- c(1:nrow(minsort))
library(knitr)
kable(minsort,row.names =T)

結果は省略