毎月勤労統計調査、TOPIX、購買力平価

xts、TTR パッケージ

毎月勤労統計調査

毎月勤労統計調査 全国調査 長期時系列表 月次 2014年12月 (2015年2月18日 更新)

25 実質賃金 指数及び増減率-現金給与総額(5人以上)(調査産業計,製造業)

平成22年平均=100(2010 average = 100)

ダウンロードしたエクセルファイルからデータセットを作成

1
2
3
4
5
6
7
8
9
d <- read.table("clipboard", header=F, sep="\t", na.strings="NA", dec=".", strip.white=TRUE)
Industries_covered <- stack(d[, c("V1","V2","V3","V4","V5","V6","V7","V8","V9","V10","V11","V12","V13","V14","V15","V16","V17","V18","V19","V20","V21","V22","V23","V24","V25")])
Industries_covered.ts<-ts(Industries_covered[,1],start=1990,freq=12)
#save(Industries_covered.ts,file="Industries_covered.dat")
d <- read.table("clipboard", header=F, sep="\t", na.strings="NA", dec=".", strip.white=TRUE)
#軸をそろえるために1990年のデータは、NAとする
YeaOnYear_growth_rates<- stack(d[, c("V1","V2","V3","V4","V5","V6","V7","V8","V9","V10","V11","V12","V13","V14","V15","V16","V17","V18","V19","V20","V21","V22","V23","V24","V25")])
YeaOnYear_growth_rates.ts<-ts(YeaOnYear_growth_rates[,1],start=1990,freq=12)
#save(YeaOnYear_growth_rates.ts,file="YeaOnYear_growth_rates.dat")
TOPIXデータは「日銀買入額」で使用したもの

topix1991_2014.dat

1
2
3
4
5
6
7
8
9
10
11
12
13
14
15
16
17
18
19
20
21
22
23
24
25
26
27
28
29
30
31
32
33
34
35
36
37
38
39
40
41
42
43
44
45
46
47
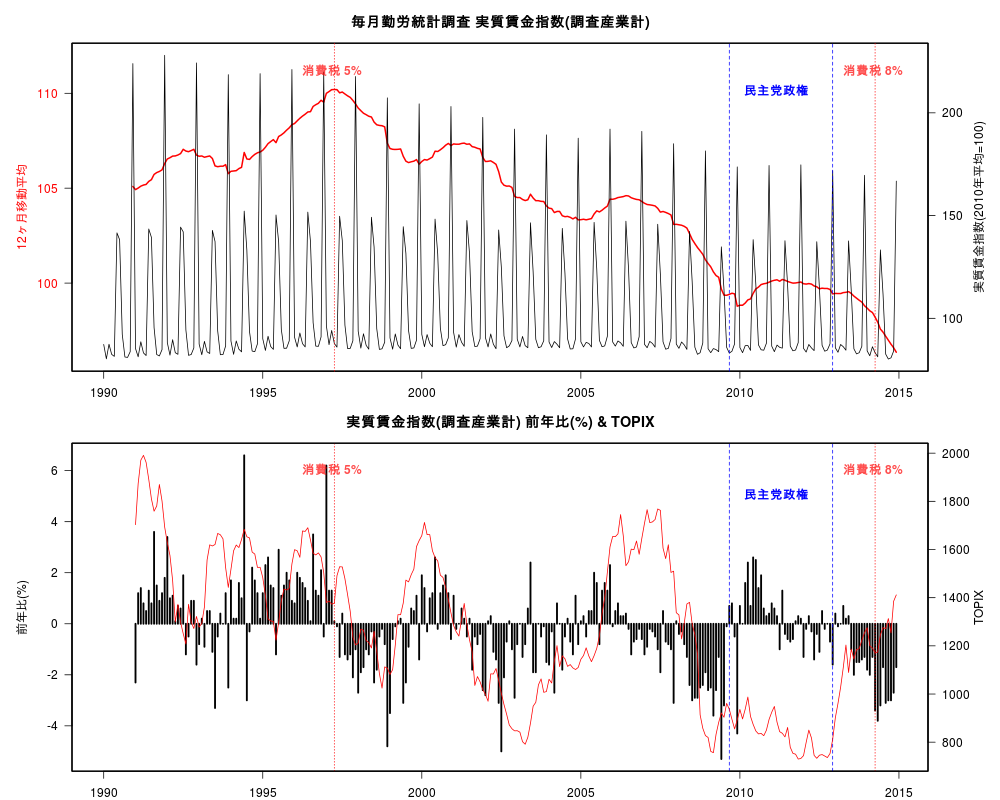
library(xts)
library(TTR)
load("topix1991_2014.dat")
topix.xts <- as.xts(read.zoo(topix1991_2014))
topix1991_2014.xts<-apply.monthly(topix.xts$Close,mean)
as.vector(coredata(topix1991_2014.xts))
rep(NA,12)
topix1991_2014<-c(rep(NA,12),as.vector(coredata(topix1991_2014.xts)))
topix_monthly.ts<-ts(topix1991_2014,start=1990,freq=12)
#save(topix_monthly.ts,file="topix_monthly.dat")
load("Industries_covered.dat")
load("YeaOnYear_growth_rates.dat")
#load("topix_monthly.dat")
#この場合、as.xtsで変換すると、yearmonクラスになる
Industries_covered.xts<-as.xts(Industries_covered.ts)
YeaOnYear_growth_rates.xts<-as.xts(YeaOnYear_growth_rates.ts)
topix_monthly.xts<-as.xts(topix_monthly.ts)
#png("laborservice01.png",width=1000,height=800)
par(mfrow=c(2,1),mar = c(2, 5, 3, 5))
plot.zoo(SMA(Industries_covered.xts,n=12),las=1,main="毎月勤労統計調査 実質賃金指数(調査産業計)",xlab="",ylab="",col="red",lwd=2,yaxt="n",ylim=c(96,112))
axis(2,las=1,col.axis="red")
mtext("12ヶ月移動平均",side=2,line=3,col="red")
par(new=T)
plot.zoo(Industries_covered.xts,xaxt="n",yaxt="n",xlab="",ylab="")
mtext("実質賃金指数(2010年平均=100)",side=4,line=3)
axis(4,las=1)
abline(v=as.yearmon("2009-09"),col="blue",lty=2) #2009-09-16
abline(v=as.yearmon("2012-12"),col="blue",lty=2) #2012-12-26
text(as.yearmon("2009-12"),210,"民主党政権",pos=4,col="blue",cex=1,font = 2)
abline(v=as.yearmon("1997-04"),col="red",lty=3) #1997年4月1日から5%
text(as.yearmon("1996-01"),220,"消費税 5%",pos=4,col=rgb(1,0,0, alpha=0.7),cex=1,font = 2)
abline(v=as.yearmon("2014-04"),col="red",lty=3) #2014-04-01
text(as.yearmon("2013-01"),220,"消費税 8%",pos=4,col=rgb(1,0,0, alpha=0.7),cex=1,font = 2)
plot.zoo(YeaOnYear_growth_rates.xts,type="h",las=1,main="実質賃金指数(調査産業計) 前年比(%) & TOPIX",xlab="",ylab="前年比(%)",lwd=2.5)
abline(v=as.yearmon("2009-09"),col="blue",lty=2) #2009-09-16
abline(v=as.yearmon("2012-12"),col="blue",lty=2) #2012-12-26
text(as.yearmon("2009-12"),5,"民主党政権",pos=4,col="blue",cex=1,font = 2)
abline(v=as.yearmon("1997-04"),col="red",lty=3) #1997年4月1日から5%
text(as.yearmon("1996-01"),6,"消費税 5%",pos=4, col=rgb(1,0,0, alpha=0.7),cex=1,font = 2)
abline(v=as.yearmon("2014-04"),col="red",lty=3) #2014-04-01
text(as.yearmon("2013-01"),6,"消費税 8%",pos=4,col=rgb(1,0,0, alpha=0.7),cex=1,font = 2)
par(new=T)
plot.zoo(topix_monthly.xts,xaxt="n",yaxt="n",xlab="",ylab="",col=rgb(1,0,0, alpha=1))
mtext("TOPIX",side=4,line=3)
axis(4,las=1)
par(mfrow=c(1,1))
#dev.off()

購買力平価

国際通貨研究所のデータ

消費者物価PPP(1973年基準)
企業物価PPP(1973年基準)
輸出物価PPP(1990年基準)

1
2
3
4
5
6
7
8
9
10
11
12
13
14
15
16
17
18
19
20
21
22
23
24
25
26
load("PPP.data")
library(xts)
library(TTR)
#library(lattice)
#library(latticeExtra)
PPP.xts<-as.xts(PPP.ts)
#png("laborservice02.png",width=1000,height=800)
par(mfrow=c(2,1),mar = c(2, 5, 3, 6))
plot.zoo(SMA(Industries_covered.xts,n=12)["2007-01::"],las=1,main="毎月勤労統計調査 実質賃金指数(調査産業計)12ヶ月移動平均 & TOPIX",xlab="",ylab="",col="red",lwd=2,yaxt="n",ylim=c(96,105))
axis(2,las=1,col.axis="red")
mtext("12ヶ月移動平均",side=2,line=3,col="red")
par(new=T)
plot.zoo(topix_monthly.xts["2007-01::"],xaxt="n",yaxt="n",xlab="",ylab="",col="black")
mtext("TOPIX",side=4,line=3)
axis(4,las=1)
abline(v=as.yearmon("2009-09"),col="blue",lty=2) #2009-09-16
abline(v=as.yearmon("2012-12"),col="blue",lty=2) #2012-12-26
text(as.yearmon("2010-12"),1600,"民主党政権",pos=4,col="blue",cex=1,font = 2)
abline(v=as.yearmon("2014-04"),col="red",lty=3) #2014-04-01
text(as.yearmon("2013-10"),1700,"消費税 8%",pos=4,col=rgb(1,0,0, alpha=1),cex=1,font = 2)
plot.zoo(PPP.xts,main="ドル円購買力平価と実勢相場 2007-2014年(国際通貨研究所のデータ)",plot.type="single",col=1:4,lwd=2,xlab="年",ylab="")
axis(4,PPP.xts[nrow(PPP.xts),],colnames(PPP.xts),col.axis="black" ,las=1)
abline(v=as.yearmon("2009-09"),col="blue",lty=2) #2009-09-16
abline(v=as.yearmon("2012-12"),col="blue",lty=2) #2012-12-26
abline(v=as.yearmon("2014-04"),col="red",lty=3) #2014-04-01
#dev.off()