「心理・教育統計法特論」第8章相関研究
ピアソンの相関係数
|
|
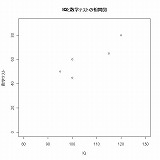
Pearson’s product-moment correlation
data: IQ and 数学テスト
t = 3.2796, df = 3, p-value = 0.04644
alternative hypothesis: true correlation is not equal to 0
95 percent confidence interval:
0.00906579 0.99234530
sample estimates:
cor
0.8842595
|
|
順位相関
スピアマンの順位祖関係数
|
|
Spearman’s rank correlation rho
data: IQ and 数学テスト
S = 3.5843, p-value = 0.08859
alternative hypothesis: true rho is not equal to 0
sample estimates:
rho
0.8207827
点数を順位にして検定
|
|
Pearson’s product-moment correlation
data: IQの順位 and 数学テストの順位
t = 2.4887, df = 3, p-value = 0.08859
alternative hypothesis: true correlation is not equal to 0
95 percent confidence interval:
-0.2228875 0.9877621
sample estimates:
cor
0.8207827
スピアマンの順位相関係数の値と一致する
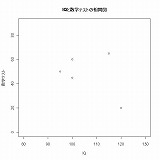
データに変更を加えた
|
|
Pearson’s product-moment correlation
data: IQ and 数学テスト
t = -0.7884, df = 3, p-value = 0.488
alternative hypothesis: true correlation is not equal to 0
95 percent confidence interval:
-0.9495011 0.7375655
sample estimates:
cor
-0.4142944
|
|
|
|
Spearman’s rank correlation rho
data: IQ and 数学テスト
S = 24.1039, p-value = 0.7406
alternative hypothesis: true rho is not equal to 0
sample estimates:
rho
-0.2051957
(注)タイ(同順位)があるのでテキストの値(タイの補正をしていない値) -0.175 とは一致しない