主成分分析

放送大学「データからの知識発見」第5章 主成分分析

標準化後の身長と体重のデータ

1
2
3
4
5
6
7
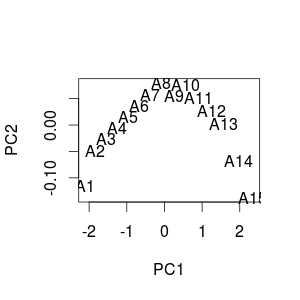
height<-c(-1.565247584,-1.341640786,-1.118033989,-0.894427191,-0.670820393,-0.447213595,-0.223606798,0,0.223606798,0.447213595,0.670820393,0.894427191,1.118033989,1.341640786,1.565247584)
weight<-c(-1.402268666,-1.273225538,-1.079660844,-0.886096151,-0.692531458,-0.498966765,-0.305402072,-0.111837378,0.146248879,0.339813573,0.59789983,0.855986088,1.114072345,1.436680167,1.759287989)
w1<-data.frame(height,weight)
row.names(w1)<-c("A1","A2","A3","A4","A5","A6","A7","A8","A9","A10","A11","A12","A13","A14","A15")
w2<-prcomp(w1)
library(xtable)
print(xtable(summary(w2)$importance[,1:2],digits=4),type="html")


PC1 PC2
Standard deviation 1.4126 0.0671
Proportion of Variance 0.9978 0.0022
Cumulative Proportion 0.9978 1.0000
1
2
plot(w2$x,type="n")
text(w2$x,rownames(w1))

標準化していない身長と体重のデータ

1
2
3
4
5
6
height<-c(147.3,149.9,152.4,154.9,157.5,160,162.6,165.1,167.6,170.2,172.7,175.3,177.8,180.3,182.9)
weight<-c(52.3,53.2,54.5,55.9,57.3,58.6,60,61.4,63.2,64.5,66.4,68.2,70,72.3,74.5)
w1<-data.frame(height,weight)
row.names(w1)<-c("A1","A2","A3","A4","A5","A6","A7","A8","A9","A10","A11","A12","A13","A14","A15")
w2<-prcomp(w1)
print(xtable(summary(w2)$importance[,1:2],digits=4),type="html")


PC1 PC2
Standard deviation 13.3535 0.5669
Proportion of Variance 0.9982 0.0018
Cumulative Proportion 0.9982 1.0000
1
2
plot(w2$x,type="n")
text(w2$x,rownames(w1))

標準化してから分析(scale=T)

1
2
w2<-prcomp(w1,scale=T)
print(xtable(summary(w2)$importance[,1:2],digits=4),type="html")


PC1 PC2
Standard deviation 1.4126 0.0670
Proportion of Variance 0.9978 0.0022
Cumulative Proportion 0.9978 1.0000