#国名もしくは国コードを指定(ここでは日本のデータを抜粋)
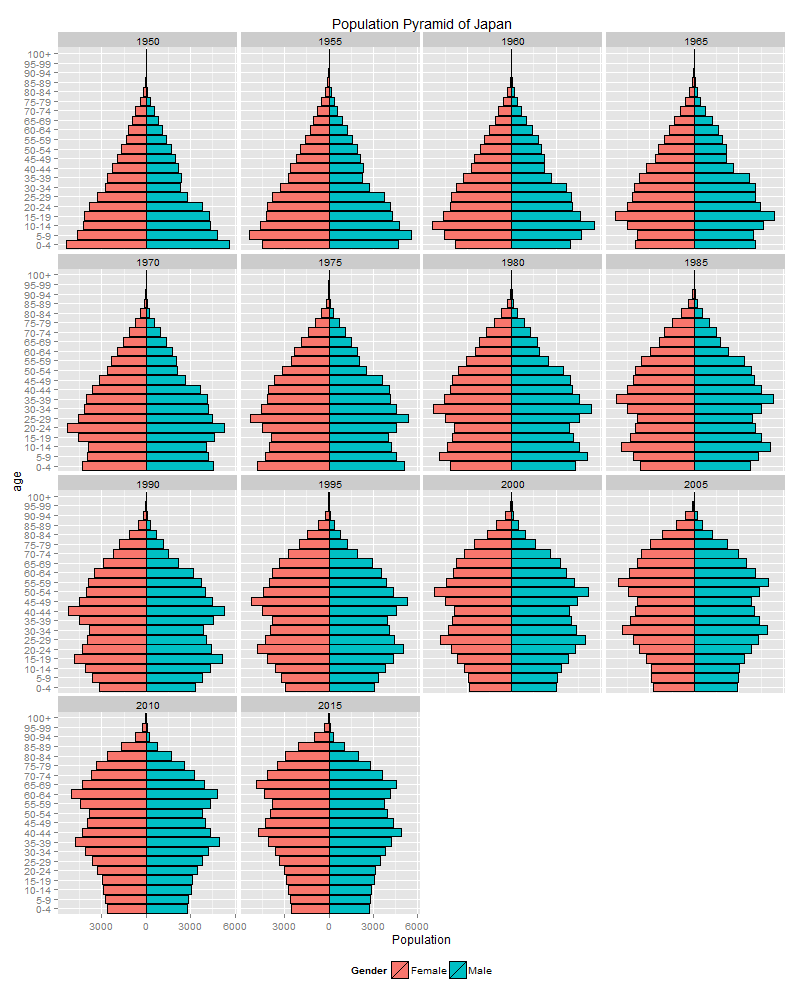
kuni<-"Japan"
#code<-392
#
#男性のデータ
popdataM<-subset(popM,country==kuni)
#popdataM<-subset(popM,country_code==code)
#確認
head(popdataM,1)
#
popdataM<-popdataM[,-c(1,2)]
popdataM$Gender<-rep("Male",nrow(popdataM))
#
#女性のデータ
popdataF<-subset(popF,country==kuni)
#popdataF<-subset(popF,country_code==code)
#確認
head(popdataF,1)
#country_codeで指定した場合に備えて
kuni<-popdataF$country[1]
#
popdataF<-popdataF[,-c(1,2)]
popdataF$Gender<-rep("Female",nrow(popdataF))
#
#データをつなげる
popdata<-rbind(popdataF,popdataM)
#
#wide -> long
popdata2<-melt(popdata,id.vars=c("age","Gender"),variable.name="year",value.name="Population",na.rm=TRUE)
#
#factorの順序付け(これをしないと年齢順に並ばない)
popdata2$age<- factor(popdata2$age,
levels=c("0-4","5-9","10-14","15-19","20-24","25-29","30-34","35-39","40-44","45-49",
"50-54","55-59","60-64","65-69","70-74","75-79","80-84","85-89","90-94","95-99","100+"))
#
#"Female"の人口データを負の値にする("Male"の反対側に棒グラフを作成するため)
for (i in 1:nrow(popdata2)){
if (popdata2$Gender[i]=="Female"){popdata2$Population[i] = -abs(popdata2$Population[i]) }
}
#
#"Male"と"Female"の人口の軸の最大値を2つのデータの最大値に等しくする
yl=max(abs(popdata2$Population))
#
#人口ピラミッド作成
#png(paste0("pop_",kuni,".png"),width=800,height=1000)
ggplot(popdata2,aes(x = age, y = Population, fill = Gender)) +
geom_bar(stat="identity", colour="black", position="identity")+
ylim(-yl,yl)+
coord_flip()+
scale_y_continuous(labels = abs)+
theme(legend.position = "bottom")+
facet_wrap(~year)+
ggtitle(paste("Population Pyramid of",kuni))
#dev.off()
#
#アニメーション作成
library(gganimate)
popdataanime<-ggplot(popdata2,aes(x = age, y = Population, fill = Gender,frame=year)) +
geom_bar(stat="identity", colour="black", position="identity")+
ylim(-yl,yl)+
scale_y_continuous(labels = abs)+
theme(legend.position = "bottom")+
coord_flip()
#
gg_animate(popdataanime,filename = paste0(kuni,"anime.gif"), title_frame = TRUE)