riverplot パッケージ
(参考)
Rでウェブ解析:川の流れのようにデータをプロット!
参議院の議席の流れをsankey-diagramで可視化する
|
|
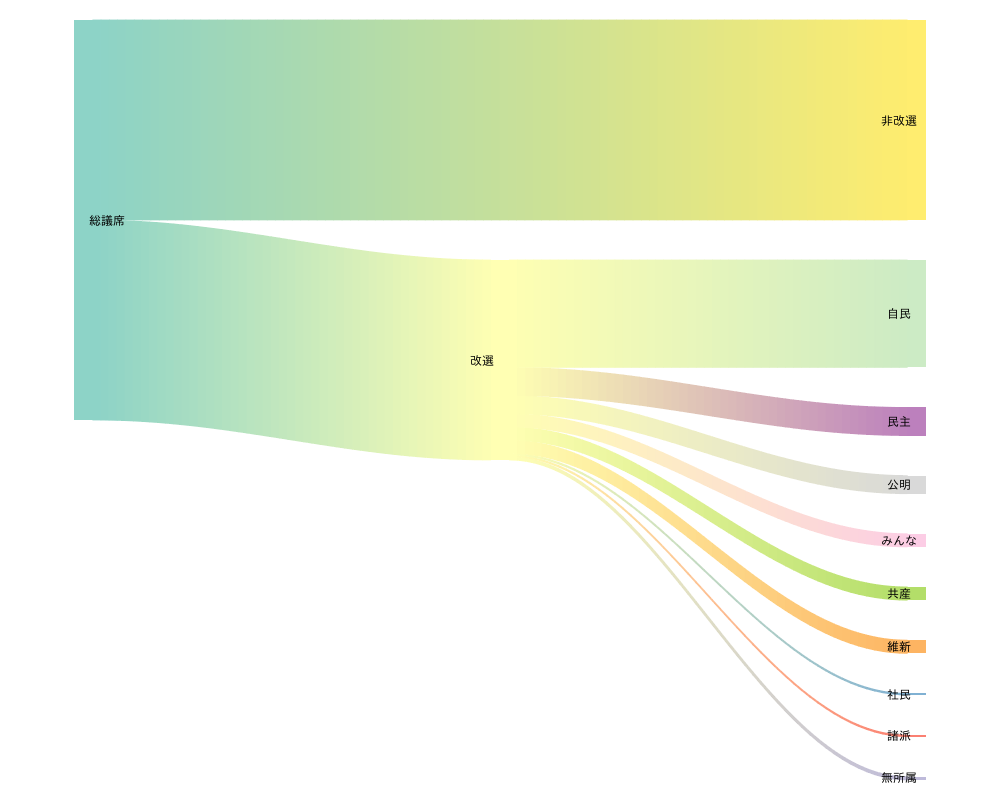
N1 N2 Value
1 総議席 改選 121
2 改選 無所属 2
3 改選 諸派 1
4 改選 社民 1
5 改選 維新 8
6 改選 共産 8
7 改選 みんな 8
8 改選 公明 11
9 改選 民主 17
10 改選 自民 65
11 総議席 非改選 121
|
|
ID x
1 総議席 1
2 改選 2
3 無所属 3
4 諸派 3
5 社民 3
6 維新 3
7 共産 3
8 みんな 3
9 公明 3
10 民主 3
11 自民 3
12 非改選 3
|
|
時計回りに90度回転した
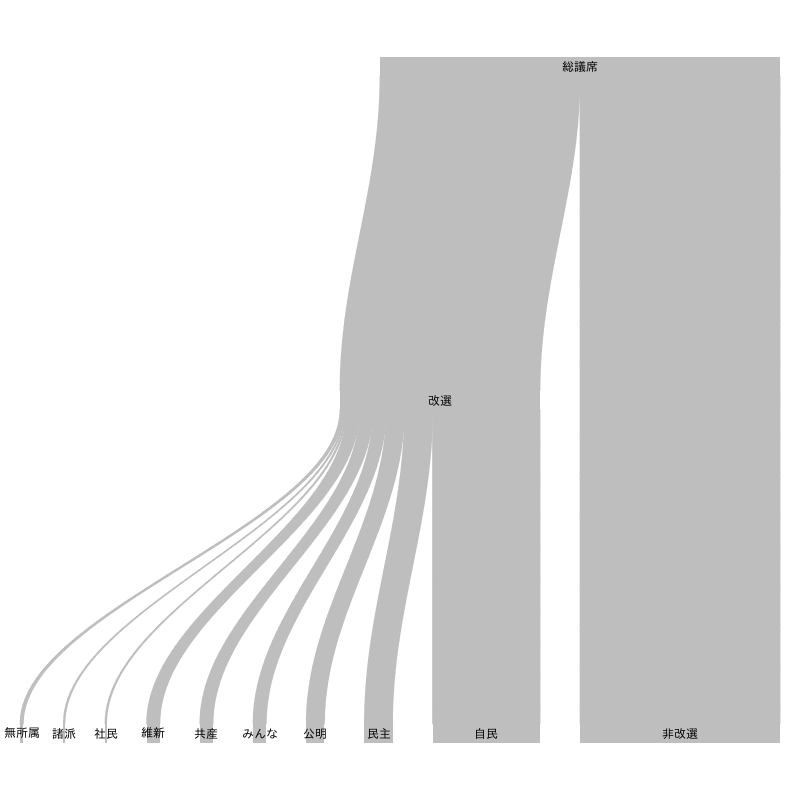
ラベルを指定。色付け。
|
|