家計調査と日経500

quantmod,xts,ggplot2,reshape2 パッケージ

家計調査(家計収支編)調査結果 より
月(二人以上の世帯)最新結果速報 平成26年(2014年)11月分
(平成26年12月26日公表)
第1表 主要家計指標-二人以上の世帯(エクセル:69KB) から
勤労者世帯の実収入、可処分所得、消費支出を抜きだしグラフ化。

kakei.dat

1
2
3
4
5
6
7
8
9
10
11
12
13
14
load("kakei.dat")
options(scipen=6)
zitsu<-kakei[,1]
kasho<-kakei[,2]
shouhi<-kakei[,3]
#png("kakei01.png", width =800, height =600)
par(mar=c(5,5,5,6),las=1,cex.axis=0.9,family="TakaoMincho")
ts.plot(zitsu,kasho,shouhi,gpars=list(xlab="",ylab="",xaxt="n",lty=c(1:3),col=c(1:3)),main="勤労者世帯の実収入・可処分所得・消費支出(単位:円) (2012/11~2014/11)")
axis(1,c("2013","2014"))
axis(4,kakei[nrow(kakei),1],"実収入",col.axis=1)
axis(4,kakei[nrow(kakei),2],"可処分所得",col.axis=2)
axis(4,kakei[nrow(kakei),3],"消費支出",col.axis=3)
grid()
#dev.off()

家計調査報告(家計収支編)―平成25年(2013年)平均速報結果の概況―
年間収入階級別1世帯当たり1か月間の収入と支出
平成25年(2013年)平均 全国・大都市・中都市・小都市+町村

二人以上の世帯のうち勤労者世帯
1
2
3
4
5
6
7
8
9
10
11
12
13
14
15
16
17
18
19
20
21
22
23
24
25
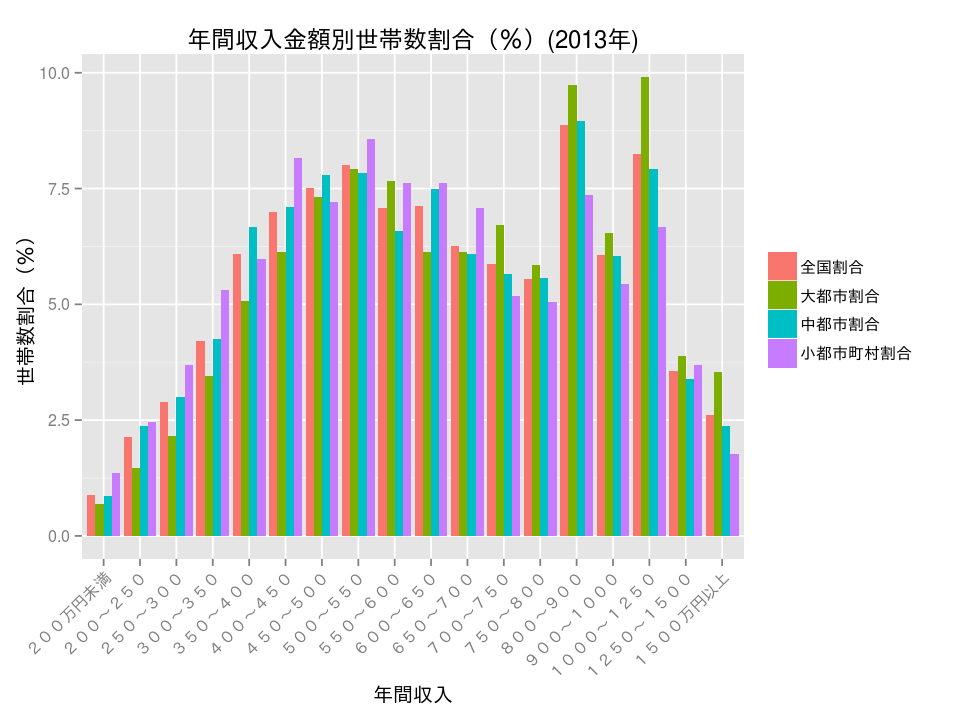
library(ggplot2)
library(reshape2)
年間収入階級<-c("200万円未満","200~250", "250~300","300~350","350~400","400~450","450~500","500~550","550~600","600~650","650~700","700~750","750~800","800~900","900~1000","1000~1250","1250~1500","1500万円以上")
No<-c(1:18)
全国<-c(35,85, 115,167,241,277,298,317,281,282,248,233,220, 352,240,327,141,104)
大都市<-c(8,17,25,40,59,71,85,92,89,71,71,78,68,113,76,115,45,41)
中都市<-c(18,49,62,88,138,147,161,162,136,155,126,117,115,185, 125,164,70,49)
小都市町村<-c(10, 18, 27, 39, 44, 60, 53, 63, 56, 56, 52, 38, 37, 54, 40, 49, 27, 13)
全国割合<-round((全国/3963)*100,2)
大都市割合<-round((大都市/1161)*100,2)
中都市割合<-round((中都市/2068)*100,2)
小都市町村割合<-round((小都市町村/734)*100,2)
年間収入階級別1世帯当たり1か月間の収入と支出<-data.frame(No,年間収入階級,全国,大都市,中都市,小都市町村,全国割合,大都市割合,中都市割合,小都市町村割合)
#save("年間収入階級別1世帯当たり1か月間の収入と支出", file="/home/user/R/work/年間収入階級別1世帯当たり1か月間の収入と支出.dat")
#load("年間収入階級別1世帯当たり1か月間の収入と支出.dat")
d<-年間収入階級別1世帯当たり1か月間の収入と支出
#temp1 <- melt(d,id=c("No","年間収入階級"), measure=c( "全国", "大都市", "中都市","小都市町村"))
temp2<- melt(d,id=c("No","年間収入階級"), measure=c( "全国割合", "大都市割合", "中都市割合","小都市町村割合"))
ggplot(temp2, aes(x=reorder(年間収入階級,No),y=value)) +
geom_bar(stat="identity", position = "dodge",aes(group=variable,fill=variable)) +
xlab("年間収入")+
ylab("世帯数割合(%)")+
ggtitle("年間収入金額別世帯数割合(%)(2013年)") +
theme(legend.title=element_blank(),axis.text.x = element_text(angle = 45, hjust = 1))
#ggsave("kakei02.png",dpi = 120, width = 8, height = 6)

日経500種平均株価(業種別日経平均株価)
月次データの最終行を削除。文字コードをutf-8で保存(linuxで使うため)。変数名、ファイル名を短く。
データ転載禁止ですのでコードとグラフのみ。

1
2
3
4
5
6
7
8
9
10
11
12
13
library(xts)
library(quantmod)
#library(ggplot2)
data <- read.table("/home/user/R/work/nikkei_500.csv", header=TRUE, sep=",", na.strings="NA", dec=".", strip.white=TRUE)
head(data)
subset(data, subset=データ日付=="2012/11/01")
#107行目から最終行までのデータを使う
nikkei500<-data[c(107:nrow(data)),c(1,3,4,5,2)]
names(nikkei500)<-c("Date","Open","High","Low","Close")
nikkei500<-as.xts(read.zoo(nikkei500))
#png("nikkei500_01.png", width =800, height =600)
candleChart(nikkei500)
#dev.off()