家計調査3

plotrix、gdata パッケージ

家計調査年報(総世帯・二人以上の世帯・単身世帯)

家計調査 家計収支編 二人以上の世帯 詳細結果表 年次

年間収入階級別(全国・都市階級)
206-3 勤労者世帯

1
2
3
4
5
6
7
8
9
10
11
12
13
14
15
16
17
18
19
20
21
22
23
24
25
26
27
#library(gdata)
#セルの結合あり:skipの調整が必要 zorin OS ではfileEncoding="cp932"を指定
#in2013 <- read.xls("http://www.e-stat.go.jp/SG1/estat/Xlsdl.do?sinfid=000023621247",sheet=1,skip=9,header=F,fileEncoding="cp932")
#in2012 <- read.xls("http://www.e-stat.go.jp/SG1/estat/Xlsdl.do?sinfid=000019023692",sheet=1,skip=9,header=F,fileEncoding="cp932")
#in2011 <- read.xls("http://www.e-stat.go.jp/SG1/estat/GL08020103.do?_xlsDownload_&fileId=000005598468&releaseCount=2",sheet=1,skip=9,header=F,fileEncoding="cp932")
#in2010 <- read.xls("http://www.e-stat.go.jp/SG1/estat/GL08020103.do?_xlsDownload_&fileId=000003972136&releaseCount=1",sheet=1,skip=9,header=F,fileEncoding="cp932")
#in2009 <- read.xls("http://www.e-stat.go.jp/SG1/estat/GL08020103.do?_xlsDownload_&fileId=000003556161&releaseCount=1",sheet=1,skip=9,header=F,fileEncoding="cp932")
#in2008 <- read.xls("http://www.e-stat.go.jp/SG1/estat/GL08020103.do?_xlsDownload_&fileId=000002203990&releaseCount=2",sheet=1,skip=9,header=F,fileEncoding="cp932")
#in2007 <- read.xls("http://www.e-stat.go.jp/SG1/estat/GL08020103.do?_xlsDownload_&fileId=000001174966&releaseCount=1",sheet=1,skip=9,header=F,fileEncoding="cp932")
#in2006 <- read.xls("http://www.e-stat.go.jp/SG1/estat/GL08020103.do?_xlsDownload_&fileId=000000331D47&releaseCount=2",sheet=1,skip=9,header=F,fileEncoding="cp932")
#in2005 <- read.xls("http://www.e-stat.go.jp/SG1/estat/GL08020103.do?_xlsDownload_&fileId=000000331AF5&releaseCount=2",sheet=1,skip=9,header=F,fileEncoding="cp932")
#in2004 <- read.xls("http://www.e-stat.go.jp/SG1/estat/GL08020103.do?_xlsDownload_&fileId=000000331ABC&releaseCount=2",sheet=1,skip=9,header=F,fileEncoding="cp932")
#in2003 <- read.xls("http://www.e-stat.go.jp/SG1/estat/GL08020103.do?_xlsDownload_&fileId=000000331A83&releaseCount=2",sheet=1,skip=9,header=F,fileEncoding="cp932")
#in2002 <- read.xls("http://www.e-stat.go.jp/SG1/estat/GL08020103.do?_xlsDownload_&fileId=000000331A4A&releaseCount=2",sheet=1,skip=9,header=F,fileEncoding="cp932")
#in2001 <- read.xls("http://www.e-stat.go.jp/SG1/estat/GL08020103.do?_xlsDownload_&fileId=000000331A0D&releaseCount=2",sheet=1,skip=9,header=F,fileEncoding="cp932")
#in2000 <- read.xls("http://www.e-stat.go.jp/SG1/estat/GL08020103.do?_xlsDownload_&fileId=0000003319D2&releaseCount=2",sheet=1,skip=9,header=F,fileEncoding="cp932")
#in2000_2013<-rbind(in2000[1,c(8,17:34)],in2001[1,c(8,17:34)],in2002[1,c(8,17:34)],in2003[1,c(8,17:34)],
#in2004[1,c(8,17:34)],in2005[1,c(8,17:34)],in2006[1,c(8,17:34)],in2007[1,c(8,17:34)],in2008[1,c(8,17:34)],
#in2009[1,c(8,17:34)],in2010[1,c(8,17:34)],in2011[1,c(8,17:34)],in2012[1,c(8,17:34)],in2013[1,c(8,17:34)])
#names(in2000_2013)<-c("年","200万円未満","200~250","250~300","300~350","350~400","400~450","450~500","500~550","550~600","600~650","650~700","700~750","750~800","800~900","900~1000","1000~1250","1250~1500","1500万円以上")
#names(in2000_2013)<-c("年","[0,200)","[200,250)","[250,300)","[300,350)","[350,400)","[400,450)","[450,500)","[500,550)","[550,600)","[600,650)","[650,700)","[700,750)","[750,800)","[800,900)","[900,1000)","[1000,1250)","[1250,1500)","[1500, )")
#読み込んだデータの数値に含まれるカンマを除去
#for (i in 2:ncol(in2000_2013)) {
#in2000_2013[,i]<-as.numeric(gsub(",","",in2000_2013[,i]))
#}
#in2000_2013$年<-c(2000:2013)
#save("in2000_2013", file="in2000_2013.dat")

作成したデータセット

in2000_2013.dat

1
2
3
4
5
6
7
8
9
10
11
12
13
14
15
16
17
library(plotrix)
load("in2000_2013.dat")
#変数名が文字化けしているのでつけ直す。
#names(in2000_2013)<-c("年","200万円未満","200~250","250~300","300~350","350~400","400~450","450~500","500~550","550~600","600~650","650~700","700~750","750~800","800~900","900~1000","1000~1250","1250~1500","1500万円以上")
names(in2000_2013)<-c("年","[0,200)","[200,250)","[250,300)","[300,350)","[350,400)","[400,450)","[450,500)","[500,550)","[550,600)","[600,650)","[650,700)","[700,750)","[750,800)","[800,900)","[900,1000)","[1000,1250)","[1250,1500)","[1500, )")
mat<-t(as.matrix(in2000_2013[,-1]))
colnames(mat)<-c(2000:2013)
df<-data.frame(mat)
names(df)<-c(2000:2013)
#
#png("income2000.png",width=1000,height=800)
par(mar=c(5,3,5,2))
#barplot(df[,1]/100,names.arg =rownames(df),main="年間収入金額別世帯数割合 (%)(勤労者世帯 )2000年",las=3)
#plot(c(1:18),df[,1]/100,type="h",lwd=30,col="lightblue",main="年間収入金額別世帯数割合 (%)(勤労者世帯 ) 2000年",xaxt = "n",las=1,lend=2,xlab="",ylab="パーセント",ylim=c(0,12))
#staxlab(1, c(1:18),labels=rownames(df), srt = 45)
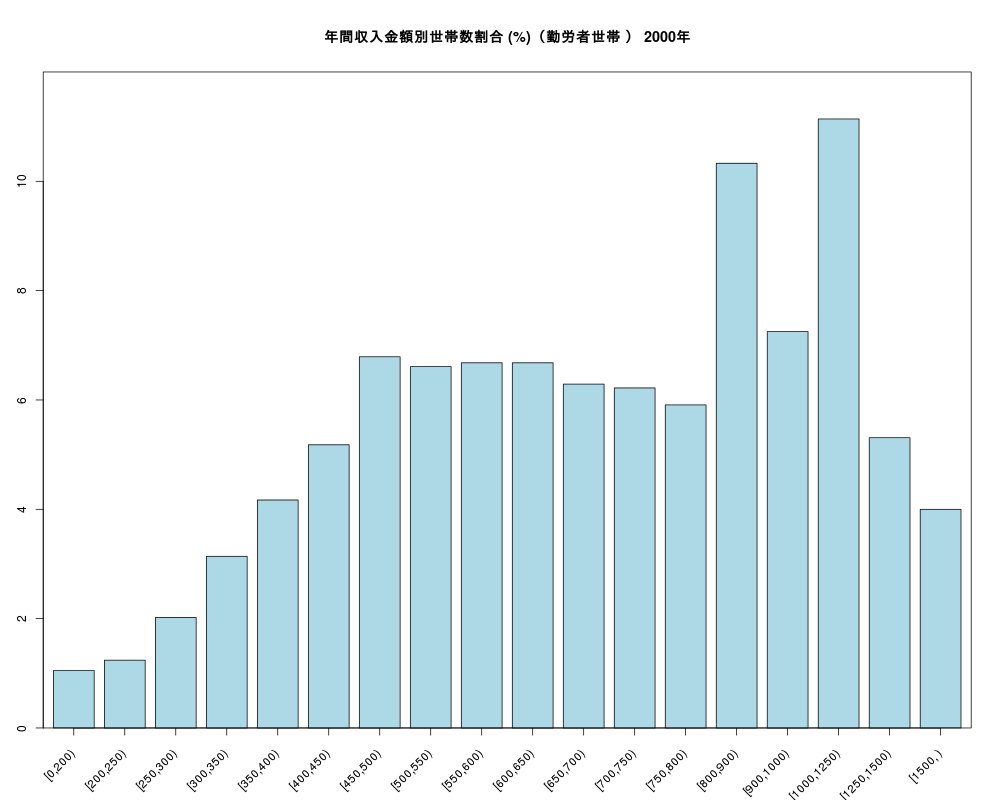
barp(df[,1]/100,names.arg=rownames(df),staxx=T,col="lightblue",ylim=c(0,12),srt=45,main="年間収入金額別世帯数割合 (%)(勤労者世帯 ) 2000年")
#dev.off()

1
2
3
4
#png("income2013.png",width=1000,height=800)
par(mar=c(5,3,5,2))
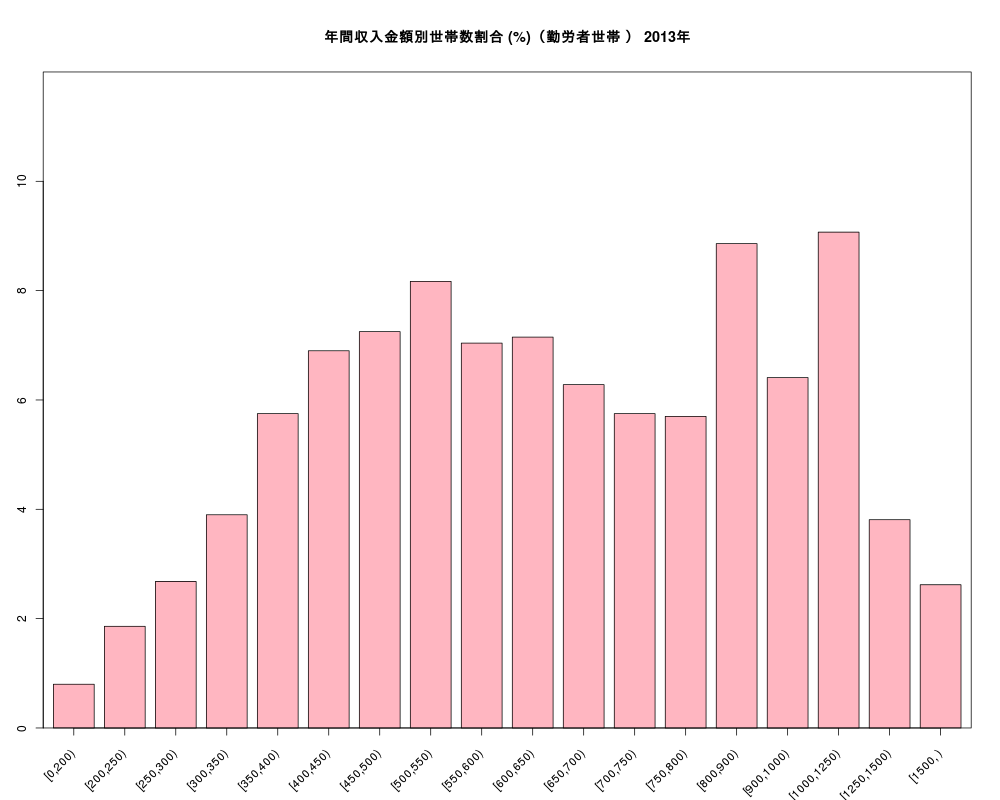
barp(df[,14]/100,names.arg=rownames(df),staxx=T,main="年間収入金額別世帯数割合 (%)(勤労者世帯 ) 2013年",col="lightpink",ylim=c(0,12),srt=45)
#dev.off()

1
2
3
4
5
6
7
8
9
10
11
12
13
14
15
16
17
18
19
df2<-cumsum(df)
#png("income2000_2013.png",width=1000,height=800)
par(mar=c(5,5,5,2))
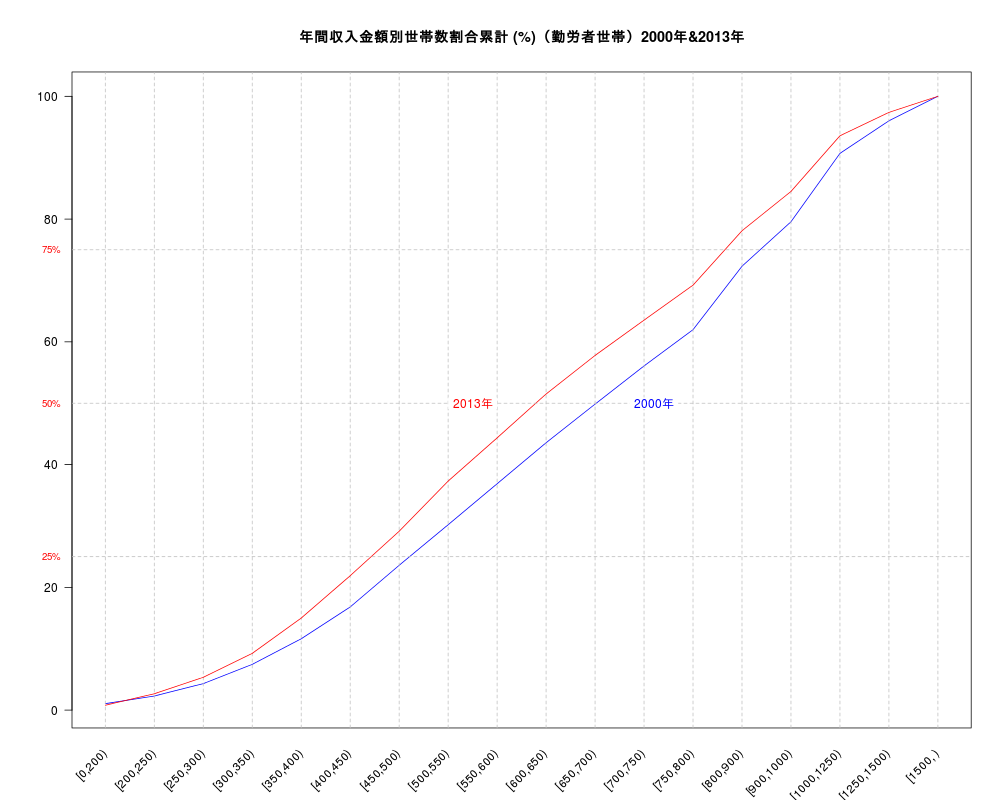
plot(c(1:18), df2[,1]/100,type="l",col="blue",xlab="",ylab="",xaxt = "n",las=1)
# X軸目盛を斜め表示
staxlab(1, at=c(1:18),labels=rownames(df2), srt = 45)
title("年間収入金額別世帯数割合累計 (%)(勤労者世帯)2000年&2013年" ) # グラフタイトルを追加
abline(v=c(1:18),lty=2,col="gray")
lines(c(1:18), df2[,14]/100,type="l",col="red")
abline(h=25,lty=2,col="gray")
abline(h=50,lty=2,col="gray")
abline(h=75,lty=2,col="gray")
#legend("topleft",legend = colnames(df[,c(1,14)]), col =c("blue","red"),lty = 1)
boxed.labels(12.2,50,"2000年",col="blue",border=0)
boxed.labels(8.5,50,"2013年",col="red",border=0)
boxed.labels(-0.1,25,"25%",col="red",border=0,cex=0.8)
boxed.labels(-0.1,50,"50%",col="red",border=0,cex=0.8)
boxed.labels(-0.1,75,"75%",col="red",border=0,cex=0.8)
#dev.off()