データベース1

RSQLiteパッケージ sqlite3

OSはlinux(zorinOS)

気象庁のHPから鳥取市の気温、気圧、降水量の1時間データを取得(2002~2014.11.25)
XML:::readHTMLTable関数を使用。
整形してweather.csv(データのみ。rownameなし)という名でRの作業フォルダに保存。

ターミナルで

1
2
3
4
5
6
7
cd Rの作業フォルダ
sqlite3 weather.db
create table table1(datetime,pressure,precipitation,temperature);
.separator ","
.import weather.csv table1
create index dateindex on table1(datetime COLLATE NOCASE);
.indices table1

weather.db ができる。

R起動

1
2
3
4
5
6
7
8
9
10
11
12
13
14
15
16
17
18
19
20
21
22
23
24
25
26
27
28
29
30
31
32
33
34
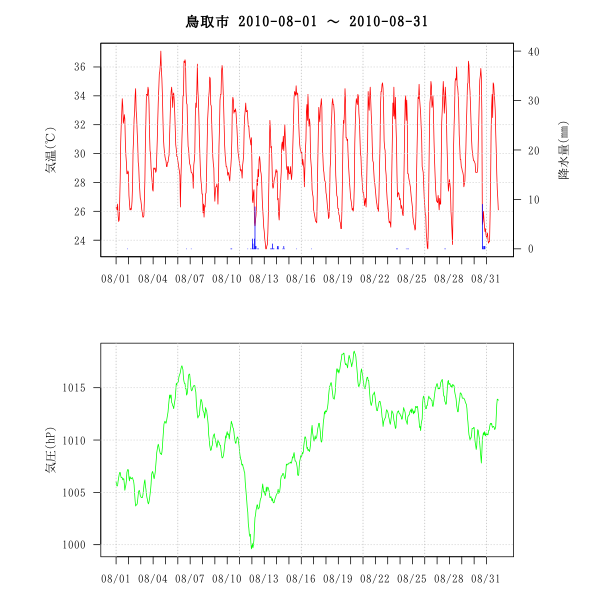
library(RSQLite)
drv <- dbDriver("SQLite")
dbfile <- "weather.db"
con <- dbConnect(drv, dbfile)
dbListTables(con)
# 2010年8月のデータを抽出
res <- dbGetQuery(con, "SELECT * FROM table1 WHERE datetime LIKE '2010-08-%';")
#res <- dbGetQuery(con, "SELECT * FROM table1 WHERE datetime COLLATE NOCASE LIKE '2010-08-%';")
# 2010年7月と8月のデータを抽出
#res <- dbGetQuery(con, "SELECT * FROM table1 WHERE datetime COLLATE NOCASE LIKE '2010-07-%' OR datetime COLLATE NOCASE LIKE '2010-08-%';")
# 2010年7月1日から8月31日まで(9月1日より前)のデータを抽出
#res <- dbGetQuery(con, "SELECT * FROM table1 WHERE datetime BETWEEN '2010-07-01' AND '2010-09-01';")
head(res);tail(res)
x<-as.POSIXlt(res[,1])
r <-as.POSIXlt(range(x))
r1 <-as.Date(range(x))
title<-paste("鳥取市",r1[1],"~",r1[2])
#png("weather201008.png", width =600, height =600) # 描画デバイスを開く
par(mar = c(3,7,3,6),mfrow=c(2,1),cex.axis=0.9,family="TakaoMincho")
plot(x,res$temperature,xaxt="n",xlab = "Date", ylab = "", main = title,las = 1,type="l",col="red")
grid(NA,NULL,lty=3)
axis.POSIXct(1, at=seq(r[1],r[2],by="1 days"), format="%m/%d")
mtext("気温(℃)", side=2, line=3)
abline(v=seq(r[1],r[2], by="5 days"),lty=3,col="gray")
par(new=T)
plot(x,res$precipitation,xaxt="n",xlab="",yaxt="n",ylab="",type="h",ylim=c(0,40),col="blue",main="")
axis(4,las=1)
mtext("降水量(mm)", side=4, line=3)
plot(x,res$pressure,xaxt="n",xlab="",ylab="気圧(hP)",type="l",col="green",ylim=c(NULL,NULL),main="",las=1)
grid(NA,NULL,lty=3)
axis.POSIXct(1, at=seq(r[1],r[2], by="1 days"), format="%m/%d")
abline(v=seq(r[1],r[2], by="5 days"),lty=3,col="gray")
par(mfrow=c(1,1))
#dev.off()

グラフにする範囲を短く

1
2
3
4
5
6
7
8
9
10
11
12
13
14
15
16
17
18
19
20
21
22
23
24
25
26
27
28
# 2010年7月1日1時から7月2日12時まで(7月2日13時より前)のデータを抽出
res <- dbGetQuery(con, "SELECT * FROM table1 WHERE datetime BETWEEN '2010-07-01 01:%' AND '2010-07-02 13:%';")
head(res);tail(res)
#png("weather20100701_02.png", width =600, height =600)
x<-as.POSIXlt(res[,1])
r <-as.POSIXlt(range(x))
#r1 <-as.Date(range(x))
title<-paste("鳥取市",r[1],"~",r[2])
par(mar = c(3,7,3,6),mfrow=c(2,1),cex.axis=0.9,family="TakaoMincho")
plot(x,res$temperature,xaxt="n",xlab = "Date", ylab = "", main = title,las = 1,type="l",col="red")
grid(NA,NULL,lty=3)
#axis.POSIXct(1, at=seq(r[1],r[2],by="1 days"), format="%m/%d")
axis.POSIXct(1, at=seq(r[1],r[2],by="1 hours"), format="%d日 %H時")
mtext("気温(℃)", side=2, line=3)
#abline(v=seq(r[1],r[2], by="5 days"),lty=3,col="gray")
abline(v=seq(r[1],r[2], by="1 hours"),lty=3,col="gray")
par(new=T)
plot(x,res$precipitation,xaxt="n",xlab="",yaxt="n",ylab="",type="h",ylim=c(0,40),col="blue",main="")
axis(4,las=1)
mtext("降水量(mm)", side=4, line=3)
plot(x,res$pressure,xaxt="n",xlab="",ylab="気圧(hP)",type="l",col="green",ylim=c(NULL,NULL),main="",las=1)
grid(NA,NULL,lty=3)
#axis.POSIXct(1, at=seq(r[1],r[2], by="1 days"), format="%m/%d")
axis.POSIXct(1, at=seq(r[1],r[2],by="1 hours"), format="%d日 %H時")
#abline(v=seq(r[1],r[2], by="5 days"),lty=3,col="gray")
abline(v=seq(r[1],r[2], by="1 hours"),lty=3,col="gray")
par(mfrow=c(1,1))
#dev.off()

1
dbDisconnect(con)