平成28年10月21日鳥取県中部の地震02

rvest , ggplot2 , xts , knitr , ggfortify パッケージ

震源リストの掲載が遅れているので
気象庁 地震情報(各地の震度に関する情報)  
震度1以上を観測した地点と地震の発生場所(震源)やその規模(マグニチュード)の情報  
を可視化した。

(注意)
検知日時ではなく情報発表日時を使うので集計の正確性に欠けます。

平成28年10月23日 16時48分現在のデータ

データの入手

1
2
3
4
5
6
7
8
9
10
11
12
13
14
15
16
17
18
19
library("rvest")
#library(Nippon)
#気象庁 地震情報(各地の震度に関する情報)
#震度1以上を観測した地点と地震の発生場所(震源)やその規模(マグニチュード)の情報
earthquake <- read_html("http://www.jma.go.jp/jp/quake/quake_local_index.html")
eqpos<-html_table(html_nodes(earthquake, "table")[[4]])
#
for ( i in 1:ncol(eqpos) ) {
#Nippon::zenhan 関数
#eqpos[,i]<-zen2han(eqpos[,i])
eqpos[,i]<-chartr("0123456789.", "0123456789.", eqpos[,i])
eqpos[,i]<-gsub("M","",eqpos[,i])
}
#(注意)検知日時ではなく情報発表日時
eqpos[,1]<-chartr("年月","//",eqpos[,1])
eqpos[,1]<-gsub("日"," ",eqpos[,1])
eqpos[,1]<-gsub("時",":",eqpos[,1])
eqpos[,1]<-gsub("分","",eqpos[,1])
eqpos[,1]<-gsub("平成..",as.character(1988+as.numeric(substring(eqpos[,1],3,4))) ,eqpos[,1])

集計

検知日時、発生場所が同じで情報発表日時が異なるデータは削除する

1
2
3
4
5
6
7
8
9
library(xts)
eqpos.xts<-xts(read.zoo(eqpos))
eq.count<-subset(eqpos.xts, 震央地名=="鳥取県中部")
#2016/10/21 以降のデータを抽出
eq20161021<-eq.count["2016-10-21::"]
#検知日時が同じデータは1つにする
#duplicated(eq20161021$検知日時)
eq20161021<-eq20161021[duplicated(eq20161021$検知日時)==FALSE]
apply.daily(eq20161021,nrow)

2016-10-21 23:40:00 86
2016-10-22 23:43:00 62
2016-10-23 14:37:00 17

1
2
3
4
5
6
#as.Date 関数 +9*60*60
#table(as.Date(index(eq20161021)+9*60*60),eq20161021$最大震度)
#substring関数を使う
#table(substring(index(eq20161021),1,10),eq20161021$最大震度)
library(knitr)
kable(table(substring(index(eq20161021),1,10),eq20161021$最大震度))
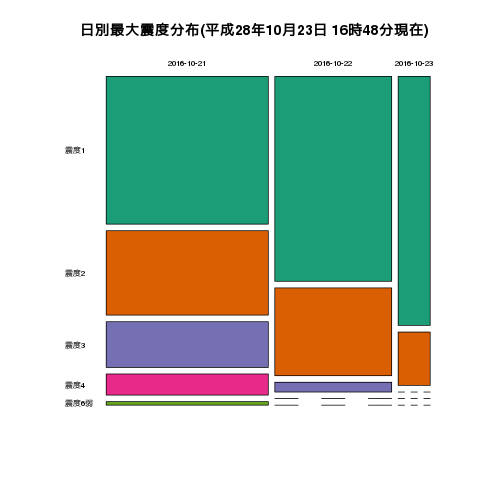
震度1 震度2 震度3 震度4 震度6弱
2016-10-21 42 24 13 6 1
2016-10-22 42 18 2 0 0
2016-10-23 14 3 0 0 0

モザイクプロット

1
2
3
4
5
#最大震度
library(RColorBrewer)
#png("mosaic1021.png")
mosaicplot(table(substring(index(eq20161021),1,10),eq20161021$最大震度),las=1,color = brewer.pal(8, "Dark2"),main="日別最大震度分布(平成28年10月23日 16時48分現在)")
#dev.off()

1
2
3
4
5
6
#マグニチュード
#mag_cut<-cut(as.numeric(eq20161021$マグニチュード),breaks=c(1,2,3,4,5,6,6.5,7),right = FALSE, include.lowest = TRUE)
#kable(table(substring(index(eq20161021),1,10),mag_cut))
#mosaicplot(table(substring(index(eq20161021),1,10),mag_cut),las=1,color = brewer.pal(8, "Dark2"),main="日別マグニチュード分布(震度1以上を観測した地震)")
#1時間ごと
#period.apply(eq20161021, INDEX=endpoints(eq20161021, on="hours", k=1),nrow)

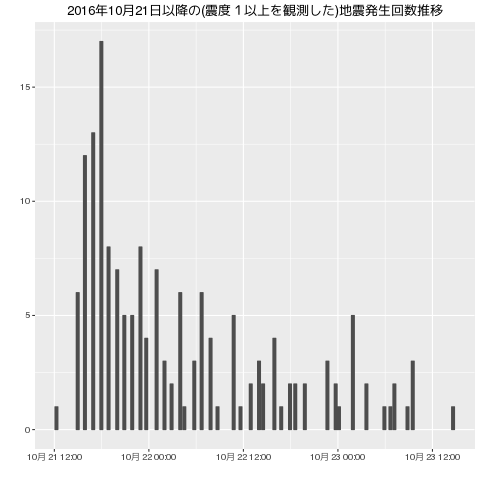
(震度1以上を観測した)地震発生回数推移(1時間)

1
2
3
4
5
6
library(ggplot2)
library(ggfortify)
#png("bar1021.png")
autoplot(period.apply(eq20161021, INDEX=endpoints(eq20161021, on="hours", k=1),nrow), ts.geom = 'bar', fill = 'gray30') +
labs(title="2016年10月21日以降の(震度1以上を観測した)地震発生回数推移")
#dev.off()