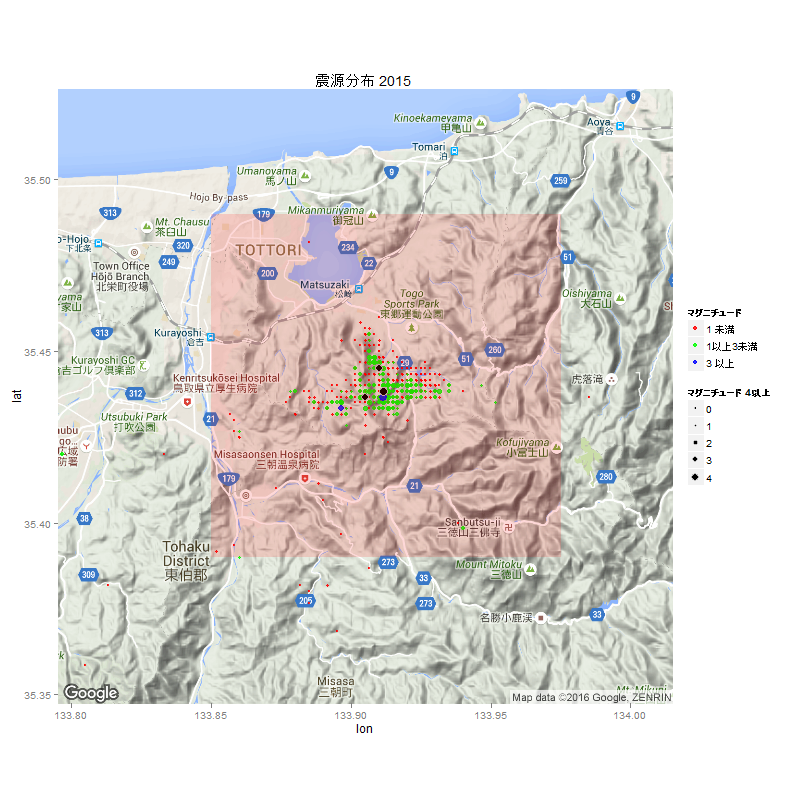
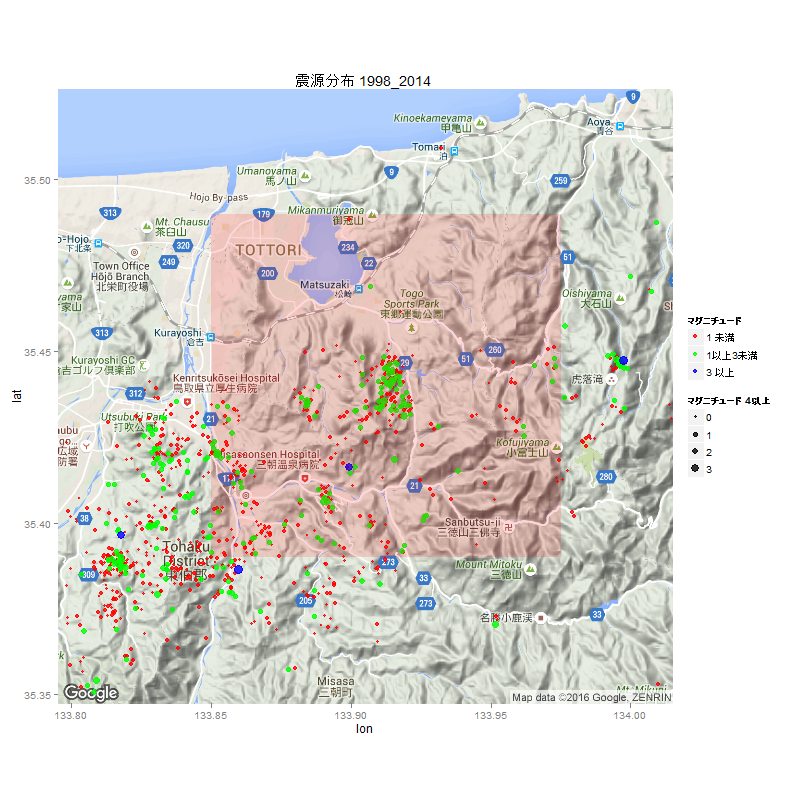
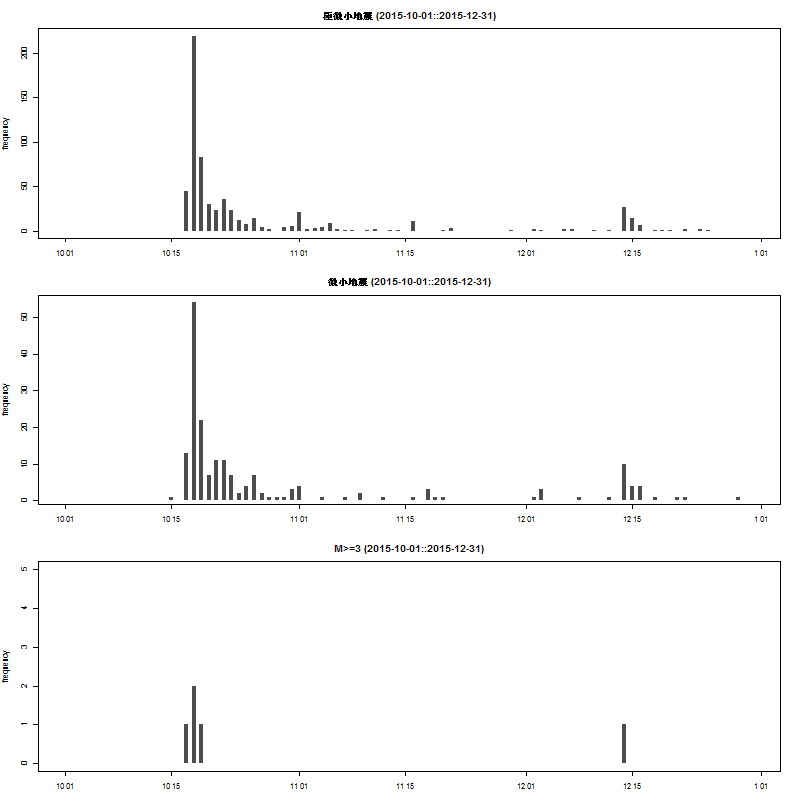
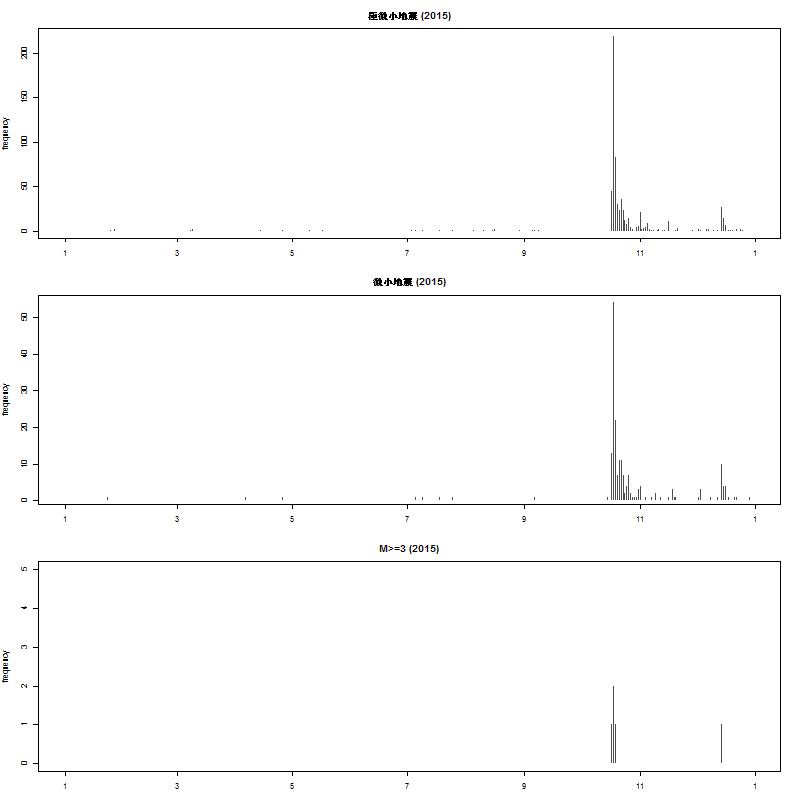
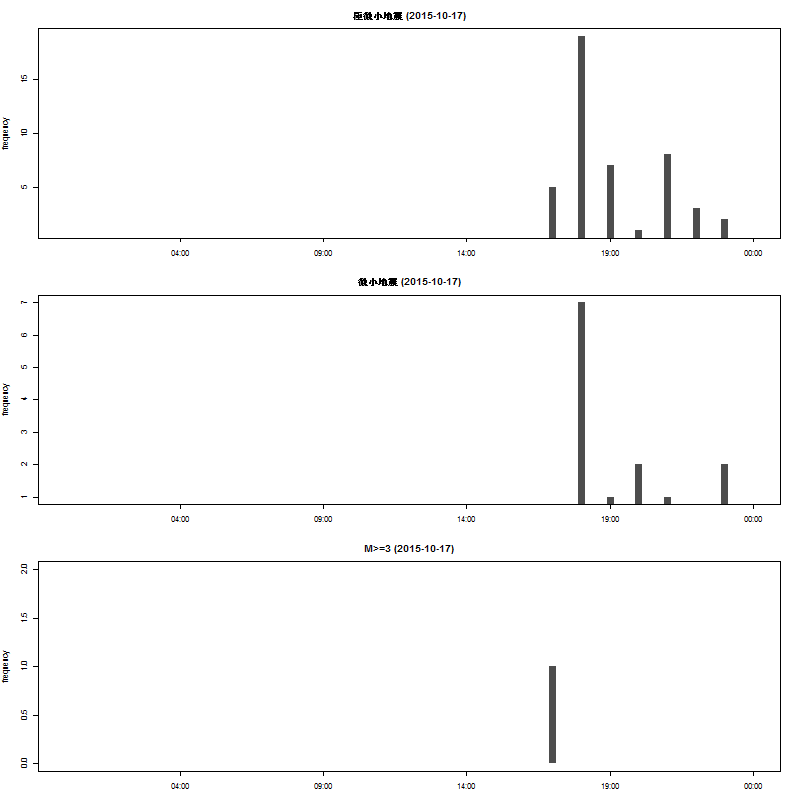
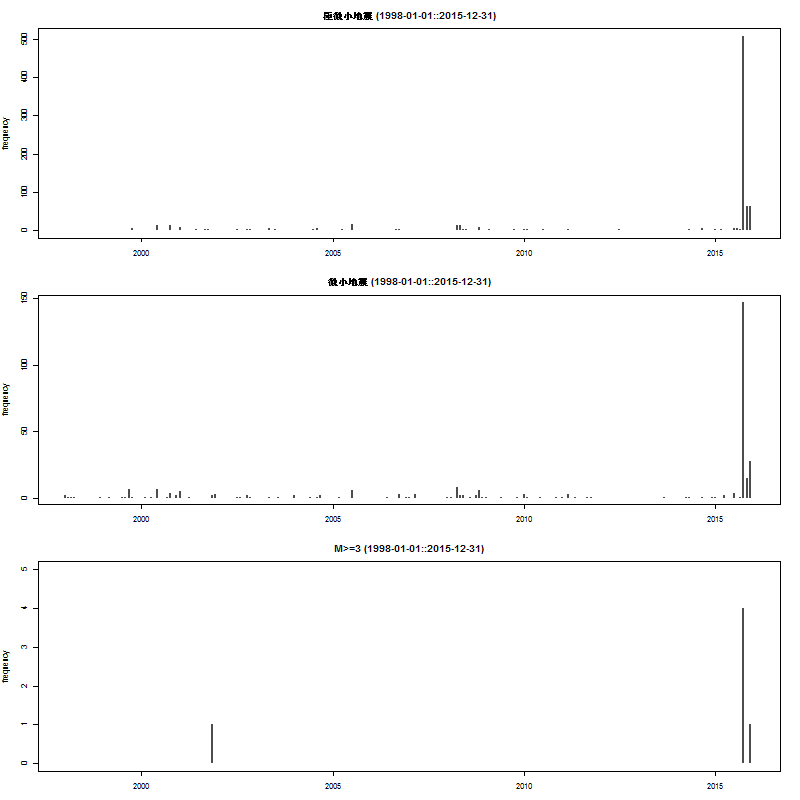
load("2015.RData") eq2015<-eqdata load("tottori1998_2014.RData") eqdata<-rbind(eqdata[,-6],eq2015) eqdata<-unique(eqdata) lon1<-c(133.85,133.975) ; lat1<-c(35.39,35.49) library(xts) eq.xts<-xts(eqdata[,2:5], strptime(eqdata$time, "%Y-%m-%d %H:%M:%S")) subeq1.xts<-subset(eq.xts,lon1[1]<=longitude & longitude<=lon1[2] & lat1[1]<=latitude & latitude<=lat1[2] & mag<1) subeq2.xts<-subset(eq.xts,lon1[1]<=longitude & longitude<=lon1[2] & lat1[1]<=latitude & latitude<=lat1[2] & mag>=1 & mag<3) subeq3.xts<-subset(eq.xts,lon1[1]<=longitude & longitude<=lon1[2] & lat1[1]<=latitude & latitude<=lat1[2] & mag>=3) date<-"2015" count1=apply.daily(subeq1.xts[date],nrow) count2=apply.daily(subeq2.xts[date],nrow) count3=apply.daily(subeq3.xts[date],nrow) lwd=3 par(mfrow=c(3,1),mar=c(3,4,3,2)) c1<-data.frame(time=as.Date(substring(index(count1),1,10)),frequency=coredata(count1)) plot(frequency~time, data=c1,type="h",main=paste0("極微小地震 (",date,")"),lend=1,lwd=lwd,col="gray30", xlim=as.Date(c("2015-01-01","2015-12-31"))) c2<-data.frame(time=as.Date(substring(index(count2),1,10)),frequency=coredata(count2)) plot(frequency~time, data=c2,type="h",main=paste0("微小地震 (",date,")"),lend=1,lwd=lwd,col="gray30", xlim=as.Date(c("2015-01-01","2015-12-31"))) c3<-data.frame(time=as.Date(substring(index(count3),1,10)),frequency=coredata(count3)) plot(frequency~time, data=c3,type="h",main=paste0("M>=3 (",date,")"),lend=1,lwd=lwd,col="gray30", xlim=as.Date(c("2015-01-01","2015-12-31")),ylim=c(0,5)) start<-"2015-10-01" end<-"2015-12-31" date<-paste0(start,"::",end) count1=apply.daily(subeq1.xts[date],nrow) count2=apply.daily(subeq2.xts[date],nrow) count3=apply.daily(subeq3.xts[date],nrow) lwd=4 par(mfrow=c(3,1),mar=c(3,4,3,2)) c1<-data.frame(time=as.Date(substring(index(count1),1,10)),frequency=coredata(count1)) plot(frequency~time, data=c1,type="h",main=paste0("極微小地震 (",date,")"),lend=1,lwd=lwd,col="gray30", xlim=as.Date(c(start,end)) ) c2<-data.frame(time=as.Date(substring(index(count2),1,10)),frequency=coredata(count2)) plot(frequency~time, data=c2,type="h",main=paste0("微小地震 (",date,")"),lend=1,lwd=lwd,col="gray30", xlim=as.Date(c(start,end)) ) c3<-data.frame(time=as.Date(substring(index(count3),1,10)),frequency=coredata(count3)) plot(frequency~time, data=c3,type="h",main=paste0("M>=3 (",date,")"),lend=1,lwd=lwd,col="gray30", xlim=as.Date(c(start,end)) ,ylim=c(0,5)) date<-"2015-10-17" t1<-endpoints(subeq1.xts[date],on="hours") count1<-period.apply(subeq1.xts[date],t1,nrow) names(count1)<-"frequency" t2<-endpoints(subeq2.xts[date],on="hours") count2<-period.apply(subeq2.xts[date],t2,nrow) names(count2)<-"frequency" t3<-endpoints(subeq3.xts[date],on="hours") count3<-period.apply(subeq3.xts[date],t3,nrow) names(count3)<-"frequency" lwd=7 par(mfrow=c(3,1),mar=c(3,4,3,2)) c1<-data.frame(time=as.POSIXct(paste0(substring(index(count1),1,13),":00:00")),coredata(count1)) plot(frequency~time, data=c1,type="h",main=paste0("極微小地震 (",date,")"),lend=1,lwd=lwd,col="gray30", xlim=as.POSIXct(c(paste0(date," 00:00:00"),paste0(date," 23:59:59"))) ) c2<-data.frame(time=as.POSIXct(paste0(substring(index(count2),1,13),":00:00")),coredata(count2)) plot(frequency~time, data=c2,type="h",main=paste0("微小地震 (",date,")"),lend=1,lwd=lwd,col="gray30", xlim=as.POSIXct(c(paste0(date," 00:00:00"),paste0(date," 23:59:59"))) ) c3<-data.frame(time=as.POSIXct(paste0(substring(index(count3),1,13),":00:00")),coredata(count3)) plot(frequency~time, data=c3,type="h",main=paste0("M>=3 (",date,")"),lend=1,lwd=lwd,col="gray30", xlim=as.POSIXct(c(paste0(date," 00:00:00"),paste0(date," 23:59:59"))) ,ylim=c(0,2)) start<-"1998-01-01" end<-"2015-12-31" date<-paste0(start,"::",end) count1=apply.monthly(subeq1.xts[date],nrow) count2=apply.monthly(subeq2.xts[date],nrow) count3=apply.monthly(subeq3.xts[date],nrow) count3 lwd=2.5 par(mfrow=c(3,1),mar=c(3,4,3,2)) c1<-data.frame(time=as.Date(paste0(substring(index(count1),1,7),"-01")),frequency=coredata(count1)) plot(frequency~time, data=c1,type="h",main=paste0("極微小地震 (",date,")"),lend=1,lwd=lwd,col="gray30", xlim=as.Date(c(start,end)) ) c2<-data.frame(time=as.Date(paste0(substring(index(count2),1,7),"-01")),frequency=coredata(count2)) plot(frequency~time, data=c2,type="h",main=paste0("微小地震 (",date,")"),lend=1,lwd=lwd,col="gray30", xlim=as.Date(c(start,end)) ) c3<-data.frame(time=as.Date(paste0(substring(index(count3),1,7),"-01")),frequency=coredata(count3)) plot(frequency~time, data=c3,type="h",main=paste0("M>=3 (",date,")"),lend=1,lwd=lwd,col="gray30", xlim=as.Date(c(start,end)) ,ylim=c(0,5)) subeq3.xts[date]
|