library(ggmap)
library(mapproj)
library(grid)
load("2015.RData")
eq2015<-eqdata
load("tottori1998_2014.RData")
eqdata<-rbind(eqdata[,-6],eq2015)
eqdata1<-subset(eqdata,mag<1)
eqdata1$Magnitude<-"1 未満"
eqdata2<-subset(eqdata,mag>=1 & mag<3)
eqdata2$Magnitude<-"1以上3未満"
eqdata3<-subset(eqdata,mag>=3)
eqdata3$Magnitude<-"3 以上"
head(eqdata1) ; tail(eqdata1)
head(eqdata2) ; tail(eqdata2)
head(eqdata3) ; tail(eqdata3)
eq<-rbind(eqdata1,eqdata2,eqdata3)
eqdata4<-subset(eqdata,mag>=4)
sortlist <- order(eqdata4$mag)
eqdata4<- eqdata4[sortlist,]
center <- geocode('kurayoshi')
tottori <- get_map(c(center$lon, center$lat), zoom = 9, maptype = 'terrain')
lon1<-c(133,133.5) ; lat1<-c(35.1,35.5)
lon2<-c(133.5,134.65) ; lat2<-c(35.2,35.65)
alpha=0.8 ; size=1
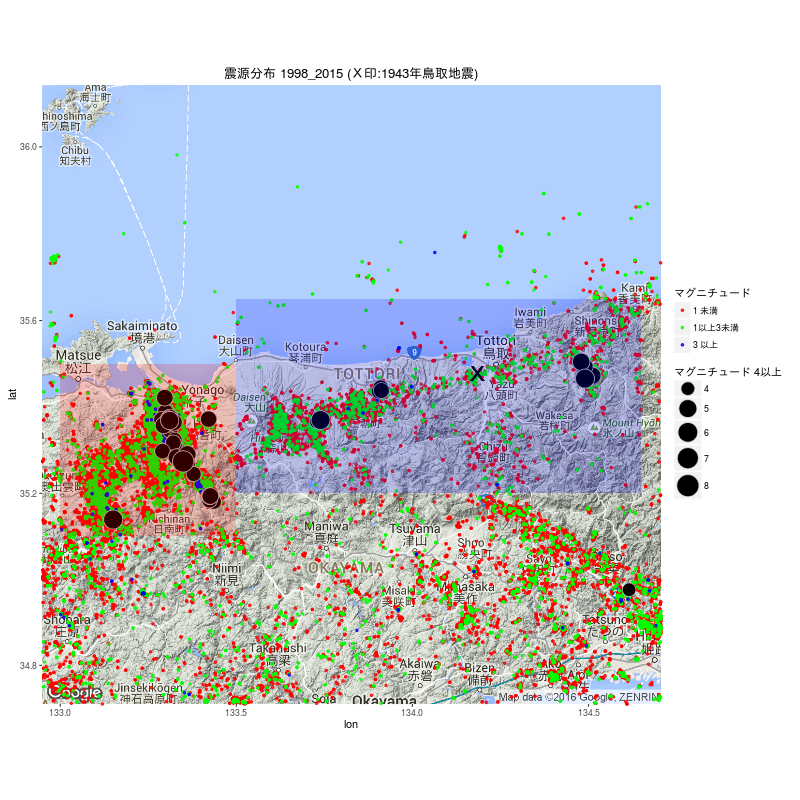
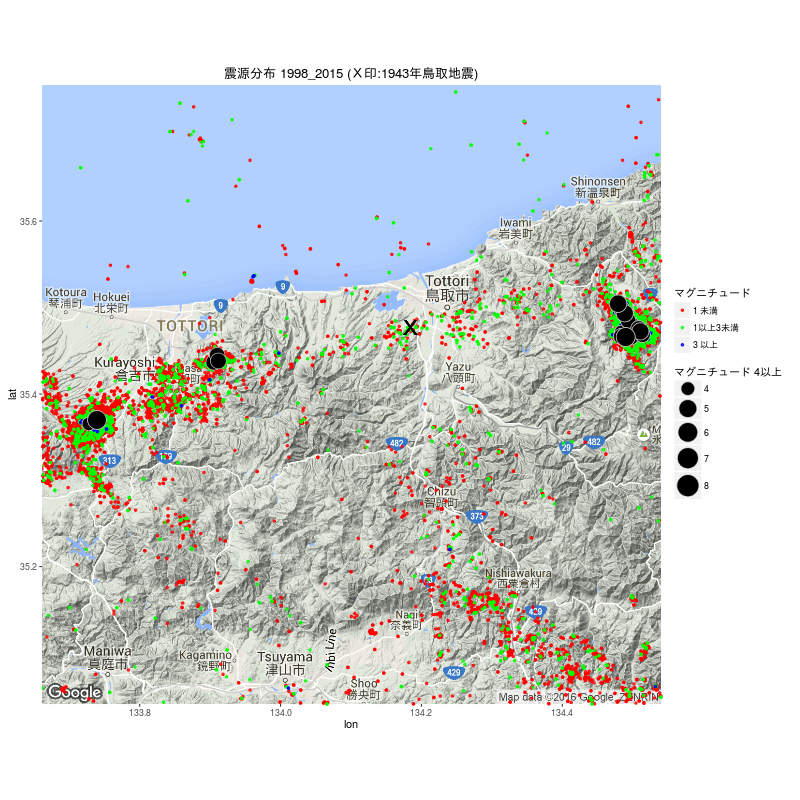
ggmap(tottori) +
geom_point(data=eq, aes(x=longitude, y=latitude,color=Magnitude),alpha=alpha,size=size)+
geom_point(data=eqdata4, aes(x=longitude, y=latitude,size=mag),alpha=1,shape=21,color="gray",fill="black")+
geom_point(aes(x=134.1844,y=35.4775),shape="X",color="black",size=7)+
geom_rect(aes(xmin=lon1[1], xmax=lon1[2], ymin=lat1[1],ymax=lat1[2]), fill="red", alpha=0.05)+
geom_rect(aes(xmin=lon2[1], xmax=lon2[2], ymin=lat2[1],ymax=lat2[2]), fill="blue", alpha=0.05)+
scale_colour_manual(values=c("red","green","blue"), breaks = c("1 未満","1以上3未満","3 以上"))+
scale_size(range = c(6,10))+
labs(colour="マグニチュード",size="マグニチュード 4以上")+
guides(size = guide_legend(order = 2), colour = guide_legend(order = 1)) +
ggtitle("震源分布 1998_2015 (X印:1943年鳥取地震)")
center <- geocode('yonago')
yonago <- get_map(c(center$lon, center$lat), zoom = 10, maptype = 'terrain')
alpha=0.8 ; size=1
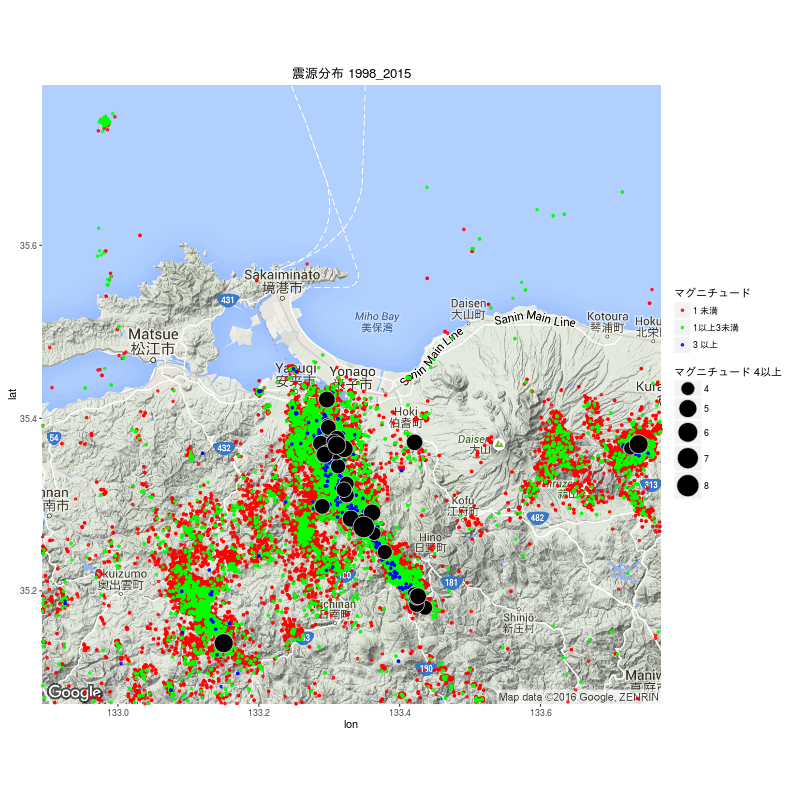
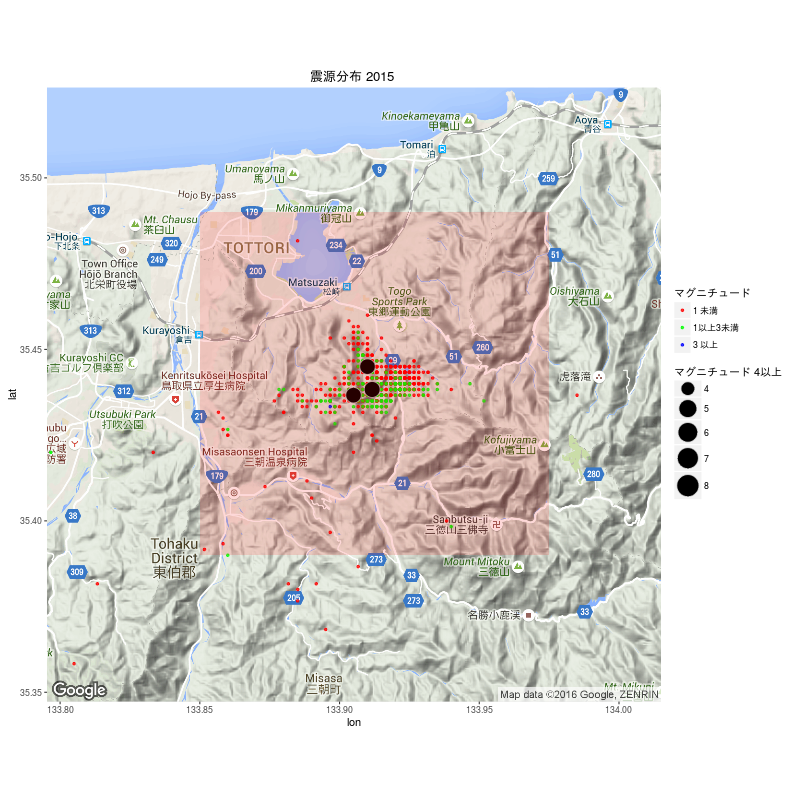
ggmap(yonago) +
geom_point(data=eq, aes(x=longitude, y=latitude,color=Magnitude),alpha=alpha,size=size)+
geom_point(data=eqdata4, aes(x=longitude, y=latitude,size=mag),alpha=1,shape=21,color="gray",fill="black")+
scale_colour_manual(values=c("red","green","blue"), breaks = c("1 未満","1以上3未満","3 以上"))+
scale_size(range = c(6,10))+
labs(colour="マグニチュード",size="マグニチュード 4以上")+
guides(size = guide_legend(order = 2), colour = guide_legend(order = 1)) +
ggtitle("震源分布 1998_2015")
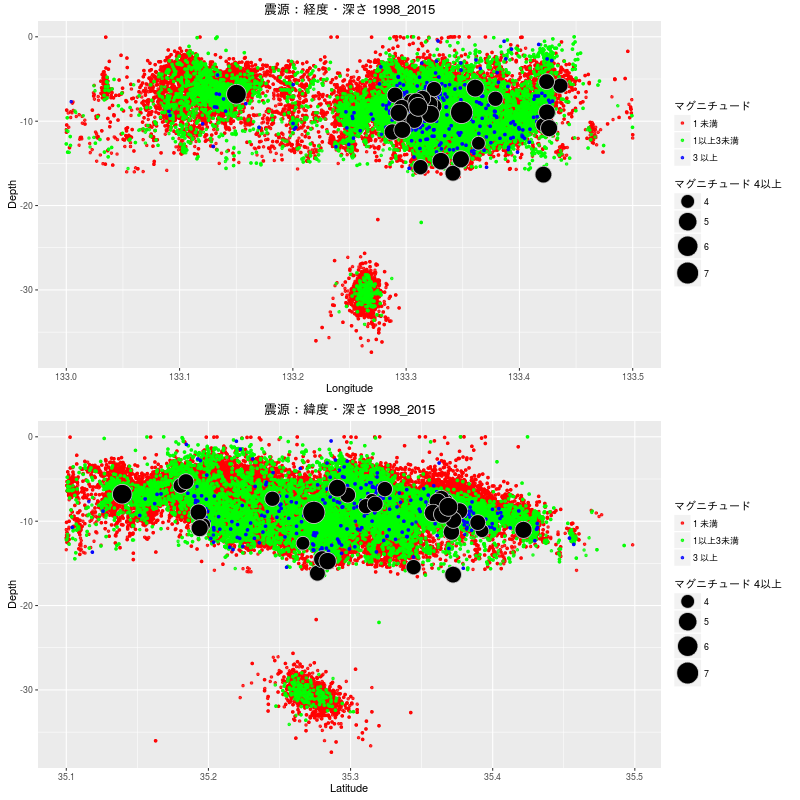
subeqdata<-subset(eq,longitude>=lon1[1] & longitude<=lon1[2] & latitude>=lat1[1] & latitude<=lat1[2])
subeqdata4<-subset(eqdata4,longitude>=lon1[1] & longitude<=lon1[2] & latitude>=lat1[1] & latitude<=lat1[2])
alpha=0.8 ; size=1
p1<-ggplot()+
geom_point(data=subeqdata,aes(x=longitude,y=-depth,color=Magnitude),alpha=alpha,size=size)+
geom_point(data=subeqdata4, aes(x=longitude, y=-depth,size=mag),alpha=1,shape=21,color="gray",fill="black")+
scale_colour_manual(values=c("red","green","blue"), breaks = c("1 未満","1以上3未満","3 以上"))+
scale_size(range = c(6,10))+
labs(colour="マグニチュード",size="マグニチュード 4以上",x="Longitude",y="Depth")+
guides(size = guide_legend(order = 2), colour = guide_legend(order = 1)) +
ggtitle("震源:経度・深さ 1998_2015")
p2<-ggplot()+
geom_point(data=subeqdata,aes(x=latitude,y=-depth,color=Magnitude),alpha=alpha,size=size)+
geom_point(data=subeqdata4, aes(x=latitude, y=-depth,size=mag),alpha=1,shape=21,color="gray",fill="black")+
scale_colour_manual(values=c("red","green","blue"), breaks = c("1 未満","1以上3未満","3 以上"))+
scale_size(range = c(6,10))+
labs(colour="マグニチュード",size="マグニチュード 4以上",x="Latitude",y="Depth")+
guides(size = guide_legend(order = 2), colour = guide_legend(order = 1)) +
ggtitle("震源:緯度・深さ 1998_2015")
grid.newpage()
pushViewport(viewport(layout=grid.layout(2, 1)))
print(p1, vp=viewport(layout.pos.row=1) )
print(p2, vp=viewport(layout.pos.row=2) )
kurayoshi <- get_map(c(134.1, 35.4), zoom = 10, maptype = 'terrain')
alpha=0.8 ; size=1
ggmap(kurayoshi) +
geom_point(data=eq, aes(x=longitude, y=latitude,color=Magnitude),alpha=alpha,size=size)+
geom_point(data=eqdata4, aes(x=longitude, y=latitude,size=mag),alpha=1,shape=21,color="gray",fill="black")+
geom_point(aes(x=134.1844,y=35.4775),shape="X",color="black",size=7)+
scale_colour_manual(values=c("red","green","blue"), breaks = c("1 未満","1以上3未満","3 以上"))+
scale_size(range = c(6,10))+
labs(colour="マグニチュード",size="マグニチュード 4以上")+
guides(size = guide_legend(order = 2), colour = guide_legend(order = 1)) +
ggtitle("震源分布 1998_2015 (X印:1943年鳥取地震)")
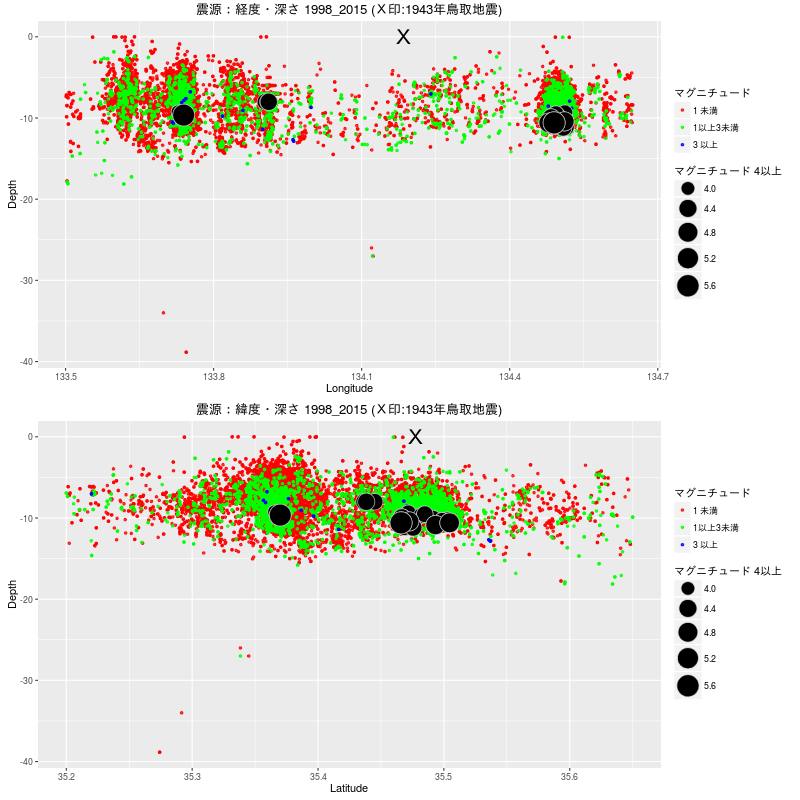
subeqdata<-subset(eq,longitude>=lon2[1] & longitude<=lon2[2] & latitude>=lat2[1] & latitude<=lat2[2])
subeqdata4<-subset(eqdata4,longitude>=lon2[1] & longitude<=lon2[2] & latitude>=lat2[1] & latitude<=lat2[2])
alpha=0.8 ; size=1
p1<-ggplot()+
geom_point(data=subeqdata,aes(x=longitude,y=-depth,color=Magnitude),alpha=alpha,size=size)+
geom_point(data=subeqdata4, aes(x=longitude, y=-depth,size=mag),alpha=1,shape=21,color="gray",fill="black")+
geom_point(aes(x=134.1844,y=0),shape="X",color="black",size=7)+
scale_colour_manual(values=c("red","green","blue"), breaks = c("1 未満","1以上3未満","3 以上"))+
scale_size(range = c(6,10))+
labs(colour="マグニチュード",size="マグニチュード 4以上",x="Longitude",y="Depth")+
guides(size = guide_legend(order = 2), colour = guide_legend(order = 1)) +
ggtitle("震源:経度・深さ 1998_2015 (X印:1943年鳥取地震)")
p2<-ggplot()+
geom_point(data=subeqdata,aes(x=latitude,y=-depth,color=Magnitude),alpha=alpha,size=size)+
geom_point(data=subeqdata4, aes(x=latitude, y=-depth,size=mag),alpha=1,shape=21,color="gray",fill="black")+
geom_point(aes(x=35.4775,y=0),shape="X",color="black",size=7)+
scale_colour_manual(values=c("red","green","blue"), breaks = c("1 未満","1以上3未満","3 以上"))+
scale_size(range = c(6,10))+
labs(colour="マグニチュード",size="マグニチュード 4以上",x="Latitude",y="Depth")+
guides(size = guide_legend(order = 2), colour = guide_legend(order = 1)) +
ggtitle("震源:緯度・深さ 1998_2015 (X印:1943年鳥取地震)")
grid.newpage()
pushViewport(viewport(layout=grid.layout(2, 1)))
print(p1, vp=viewport(layout.pos.row=1) )
print(p2, vp=viewport(layout.pos.row=2) )
