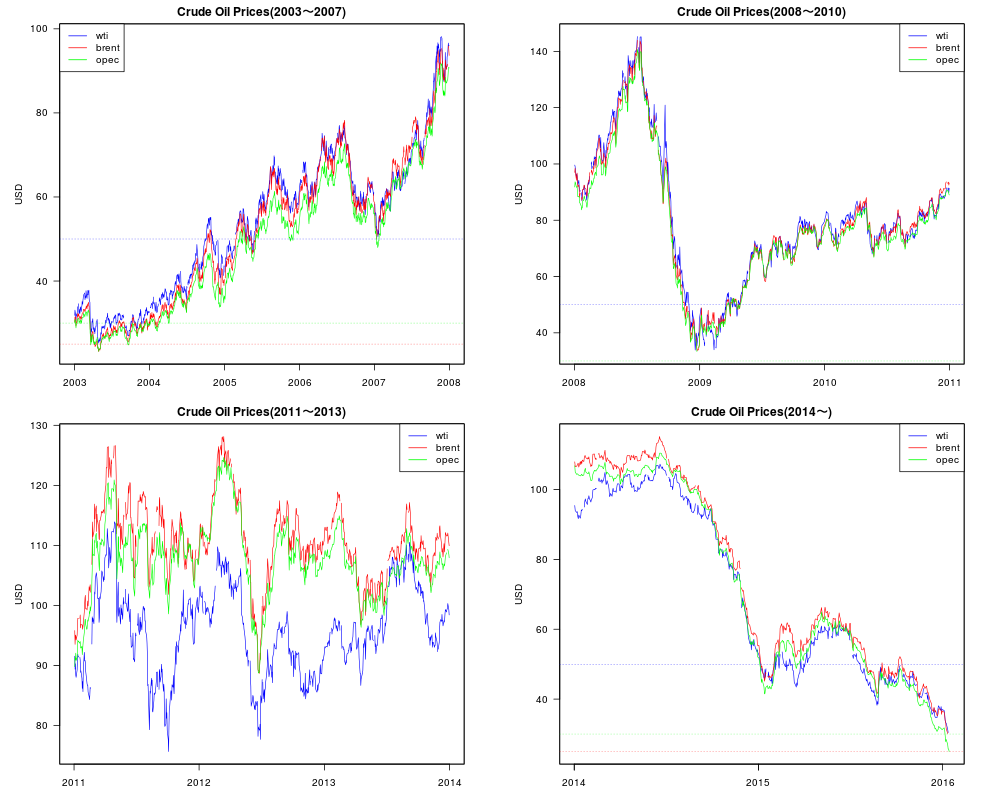
OPECバスケット価格

xts ,gdata パッケージ

OPEC Basket Price

1
2
3
4
5
6
7
8
9
10
11
12
13
14
15
16
17
18
library(xts)
doc <- readLines("http://www.opec.org/basket/basketDayArchives.xml")
doc <- subset(doc, grepl("BasketList data=",doc))
d<-gsub("\"","",gsub("<BasketList data=","",gsub("val=","",gsub(" />","",doc))))
Price<-xts(as.numeric(substring(d,11)),as.Date(substring(d,1,10)))
names(Price)<-"OPEC"
tail(Price)
#png("opec01.png",width=1000,height=800)
par(mfrow=c(2,1),mar=c(3,5,2,3))
plot.zoo(Price,xlab="Year",ylab="USD")
abline(h=c(25,30,50),lty=3,lwd=0.5,col=c("red","green","blue"))
title("OPEC Basket Price")
#
plot.zoo(Price["2015::",],xlab="Year",ylab="USD")
abline(h=c(25,30,50),lty=3,lwd=0.5,col=c("red","green","blue"))
title("OPEC Basket Price(2015~)")
par(mfrow=c(1,1))
#dev.off()

1
2
3
4
5
6
7
8
9
10
11
12
13
14
15
16
17
18
19
20
21
22
23
24
25
26
27
28
29
30
31
32
33
34
35
36
37
library(gdata)
opec<-data.frame(date=substring(d,1,10),opec=as.numeric(substring(d,11)))
#wtiのデータダウンロード
d1<-read.xls("http://www.eia.gov/dnav/pet/hist_xls/RCLC1d.xls",sheet=2,skip=3,header=F)
wti<-d1
#ここで日付けの書式を確認
head(wti)
names(wti)<-c("date","wti")
#
Sys.setlocale("LC_TIME", "C")
#windowsとlinuxとでは日付けの書式が微妙に違うことあり
#以下はlinuxの場合
#wti$date<-strptime(wti$date,format ="%b %d, %Y")
#以下はwindowsの場合
wti$date<-strptime(wti$date,format ="%b %d %Y")
head(wti)
#brent のデータダウンロード
d1<-read.xls("http://www.eia.gov/dnav/pet/hist_xls/RBRTEd.xls",sheet=2,skip=3,header=F)
brent<-d1
head(brent)
names(brent)<-c("date","brent")
Sys.setlocale("LC_TIME", "C")
#以下はlinuxの場合
#brent$date<-strptime(brent$date,format ="%b %d, %Y")
#以下はwindowsの場合
brent$date<-strptime(brent$date,format ="%b %d %Y")
head(brent)
#rm(d1)
#mergeするall=Tをつけること
oil <- merge(merge(wti,brent, all=T),opec,all=T)
oil.xts <- as.xts(zoo(oil[,-1]), as.POSIXct(oil[,1]))
#Crude Oil Prices(2003~)
#png("opec02.png",width=1000,height=800)
plot.zoo(oil.xts['2003::'],col = c("blue","red","green"), lwd=0.8,las=1,plot.type = "single" , xlab="Year", ylab="USD",main="Crude Oil Prices(2003~)")
legend("topleft", colnames(oil.xts), lty = 1, col = c("blue","red","green"))
abline(h=c(25,30,50),lty=3,lwd=0.5,col=c("red","green","blue"))
#dev.off()

1
2
3
4
5
6
7
8
9
10
11
12
13
14
15
16
17
18
19
20
#png("opec03.png",width=1000,height=800)
par(mfrow=c(2,2),mar=c(3,5,2,3))
#Crude Oil Prices(2003~2007)
plot.zoo(oil.xts['2003::2007'],col = c("blue","red","green"), lwd=0.8,las=1,plot.type = "single" , xlab="Year", ylab="USD",main="Crude Oil Prices(2003~2007)")
legend("topleft",colnames(oil.xts), lty = 1, col = c("blue","red","green"))
abline(h=c(25,30,50),lty=3,lwd=0.5,col=c("red","green","blue"))
#Crude Oil Prices(2008~2010)
plot.zoo(oil.xts['2008::2010'],col = c("blue","red","green"), lwd=0.8,las=1,plot.type = "single" , xlab="Year", ylab="USD",main="Crude Oil Prices(2008~2010)")
legend("topright",colnames(oil.xts), lty = 1, col = c("blue","red","green"))
abline(h=c(25,30,50),lty=3,lwd=0.5,col=c("red","green","blue"))
#Crude Oil Prices(2011~2013)
plot.zoo(oil.xts['2011::2013'],col = c("blue","red","green"), lwd=0.8,las=1,plot.type = "single" , xlab="Year", ylab="USD",main="Crude Oil Prices(2011~2013)")
legend("topright",colnames(oil.xts), lty = 1, col = c("blue","red","green"))
abline(h=c(25,30,50),lty=3,lwd=0.5,col=c("red","green","blue"))
#Crude Oil Prices(2014~)
plot.zoo(oil.xts['2014::'],col = c("blue","red","green"), lwd=0.8,las=1,plot.type = "single" , xlab="Year", ylab="USD",main="Crude Oil Prices(2014~)")
legend("topright",colnames(oil.xts), lty = 1, col = c("blue","red","green"))
abline(h=c(25,30,50),lty=3,lwd=0.5,col=c("red","green","blue"))
par(mfrow=c(1,1))
#dev.off()

1
2
3
4
5
6
#Crude Oil Prices(2015-09~)
#png("opec04.png",width=1000,height=800)
plot.zoo(oil.xts['2015-09::'],col = c("blue","red","green"), lwd=0.8,las=1,plot.type = "single" , xlab="Year", ylab="USD",main="Crude Oil Prices(2015.09~)")
legend("topright",colnames(oil.xts), lty = 1, col = c("blue","red","green"))
abline(h=c(25,30,50),lty=3,lwd=0.5,col=c("red","green","blue"))
#dev.off()

  • 特に「OPECバスケット価格」の下落がひどい