西之島の標高データとランドサットデータを重ねる(2)

raster パッケージ

国土地理院標高データ(projection変更済み)にランドサットの温度データ(夜間)を重ねる。

(使用するデータ)
「地理院地図」に西之島付近の噴火活動関連情報を掲載しています
標高データ 撮影日 平成27年7月28日
nishi20150728.Rdata という名で保存済み。<- 西之島の標高データとランドサットデータを重ねる(1)

ランドサットのデータ
LandBrowser

nishi20150728.Rdataを読み込む。

1
2
3
4
5
6
7
8
library(raster)
load("nishi20150728.Rdata")
nishi_rt<-nishi20150728
slope <- terrain(nishi_rt,opt='slope')
aspect <- terrain(nishi_rt,opt='aspect')
hill <- hillShade(slope, aspect, 40, 270)
#plot(hill, col=grey(0:100/100),legend=FALSE,box=F,axes=F)
#plot(nishi_rt, col=terrain.colors(25, alpha=0.6),add=TRUE,box=F,axes=F)

ランドサットのデータを読み込む。(2015-09-21のデータ)

1
2
3
4
5
6
7
8
9
10
11
12
13
14
15
16
17
18
19
20
21
22
23
24
25
26
27
28
29
30
31
32
33
34
35
36
37
38
39
40
41
42
43
#付け加えた関数(landsat8のメタファイル(ファイル名の後ろが"_MTL.txt")を読み込む)
read.meta<- function(product){
meta.file <- paste0(product, "/", product, "_MTL.txt")
textLines <- readLines(meta.file)
met <- read.table(text=textLines[grep("=", textLines)],header = FALSE, sep = "=", strip.white = TRUE,
stringsAsFactors = FALSE,row.names = NULL, col.names = c("name", "value"))
met <- met[!met$name == "GROUP", ]
met <- met[!met$name == "END_GROUP", ]
rownames(met) <- tolower(met[, "name"])
met[, "name"] <- NULL
met <- as.list(as.data.frame(t(met), stringsAsFactors = FALSE))
return(met)
}
library(rLandsat8)
library(colorRamps)
#setwd("e:/nishinoshima")
#西之島 path:105 row:041
product <- "LC82052032015264LGN00"
Crop<-c(485700,491000,3011000,3016000)
fname0<-"nishinoshima"
#メタデータの読み込み
meta<-read.meta(product)
date<-meta$date_acquired
#保存するファイル名,作成する画像のファイル名の基礎
fname<-paste0(fname0,substr(date,1,4),substr(date,6,7),substr(date,9,10))
#解像度=30m
OLI<-stack(c(aerosol=paste0(product,"/",product, "_B1.TIF"),blue=paste0(product,"/",product, "_B2.TIF"),
green=paste0(product,"/",product, "_B3.TIF"),red=paste0(product,"/",product, "_B4.TIF"),
nir=paste0(product,"/",product, "_B5.TIF"),swir1=paste0(product,"/",product, "_B6.TIF"),
swir2=paste0(product,"/",product, "_B7.TIF"),cirrus=paste0(product,"/",product, "_B9.TIF")))
#解像度=15m
PAN <-stack(paste0(product,"/",product, "_B8.TIF"))
names(PAN)<-"panchromatic"
#解像度=100m
TIRS<-stack(c(tirs1=paste0(product,"/",product, "_B10.TIF"),tirs2=paste0(product,"/",product, "_B11.TIF")))
#必要な部分の切り出し
subOLI <- crop(OLI,Crop)
subPAN <- crop(PAN,Crop)
subTIRS <- crop(TIRS,Crop)
##
bands=c(unstack(subOLI)[1:7],unstack(subPAN),unstack(subOLI)[8],unstack(subTIRS))
l<-list(metadata = meta, band = bands)
names(l$band)<-c("aerosol","blue", "green", "red","nir","swir1","swir2","panchromatic","cirrus","tirs1","tirs2")
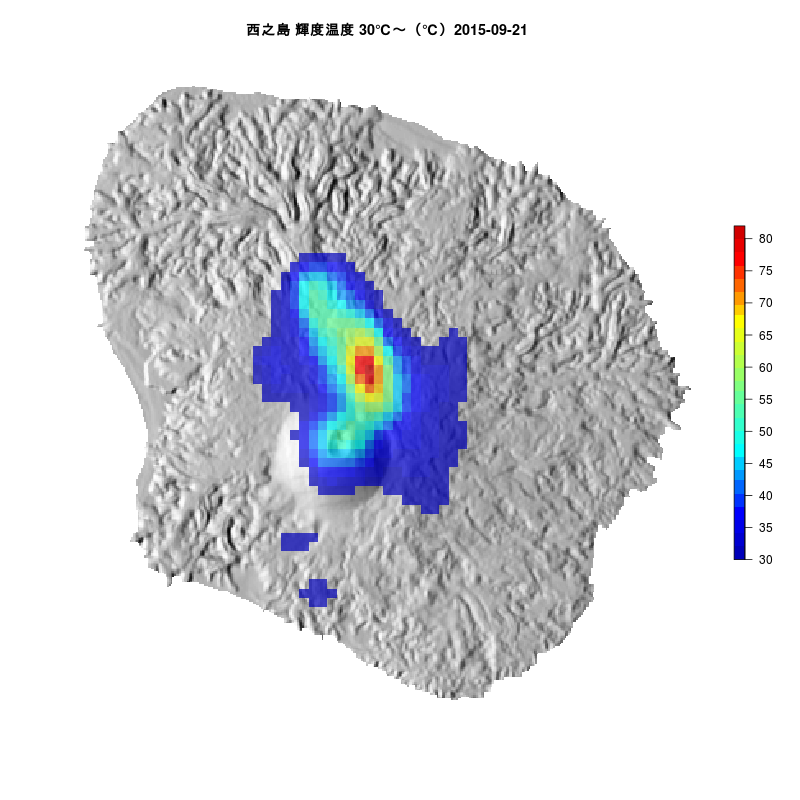
Band10から算出した温度(見やすくするために30℃以下はNA)
1
2
3
4
5
6
7
#スペクトル放射輝度から温度(btemp: 絶対温度(K))
btemp <- ToAtSatelliteBrightnessTemperature(l, band="tirs1")
# 絶対温度を摂氏に変換
SST <-btemp-273.15
#30℃以下はNAとする。
SST[SST[]<=30]<-NA
SST

class : RasterLayer
dimensions : 167, 176, 29392 (nrow, ncol, ncell)
resolution : 30, 30 (x, y)
extent : 485715, 490995, 3010995, 3016005 (xmin, xmax, ymin, ymax)
coord. ref. : +proj=utm +zone=54 +datum=WGS84 +units=m +no_defs +ellps=WGS84 +towgs84=0,0,0
data source : in memory
names : layer
values : 30.01514, 80.01945 (min, max)

標高データとランドサットデータを重ねて表示。
但し、観測日時が異なるのでずれが多少生じる。

1
2
3
4
5
6
7
8
9
10
11
12
13
#slope <- terrain(nishi_rt, opt='slope')
#aspect <- terrain(nishi_rt, opt='aspect')
#hill <- hillShade(slope, aspect, 40, 270)
#png(paste0(fname,"_1.png"),width=800,height=800)
breakpoints <- seq(30,82,2)
plot(hill, col=grey(0:100/100), legend=FALSE,main="西之島 輝度温度 30℃~(℃)2015-09-21",box=F,axes=F)
plot(SST,col=blue2green2red(length(breakpoints)),legend=F,axes=FALSE,box=FALSE,breaks=breakpoints,alpha=0.7,add=T)
plot(SST, legend.only=TRUE,col=blue2green2red(length(breakpoints)),
legend.width=1, legend.shrink=0.5,breaks=breakpoints,
axis.args=list(at=seq(30,82,5),
labels=seq(30,82,5),
cex.axis=1))
#dev.off()

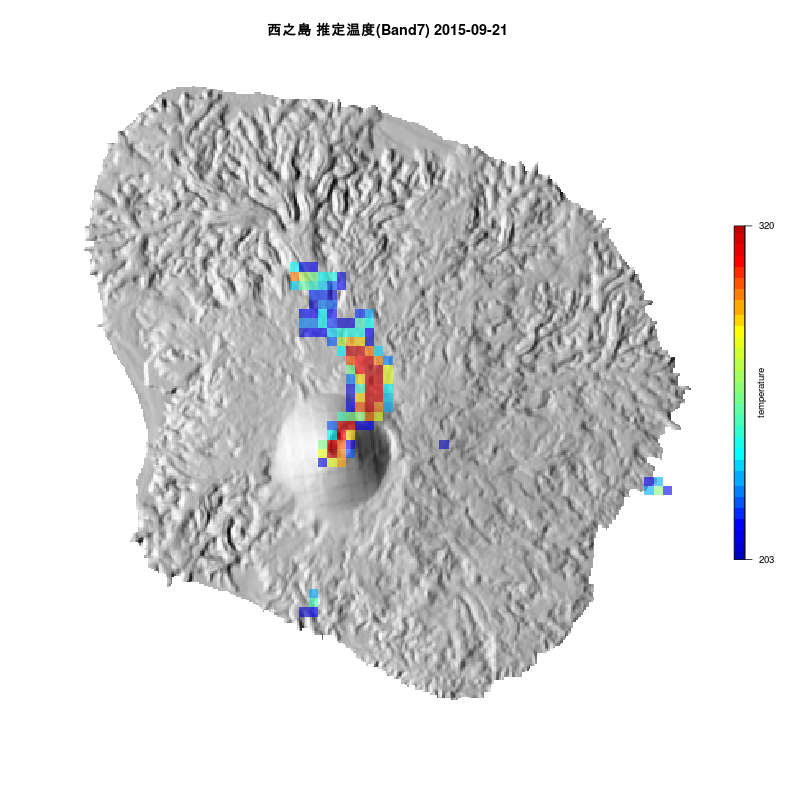
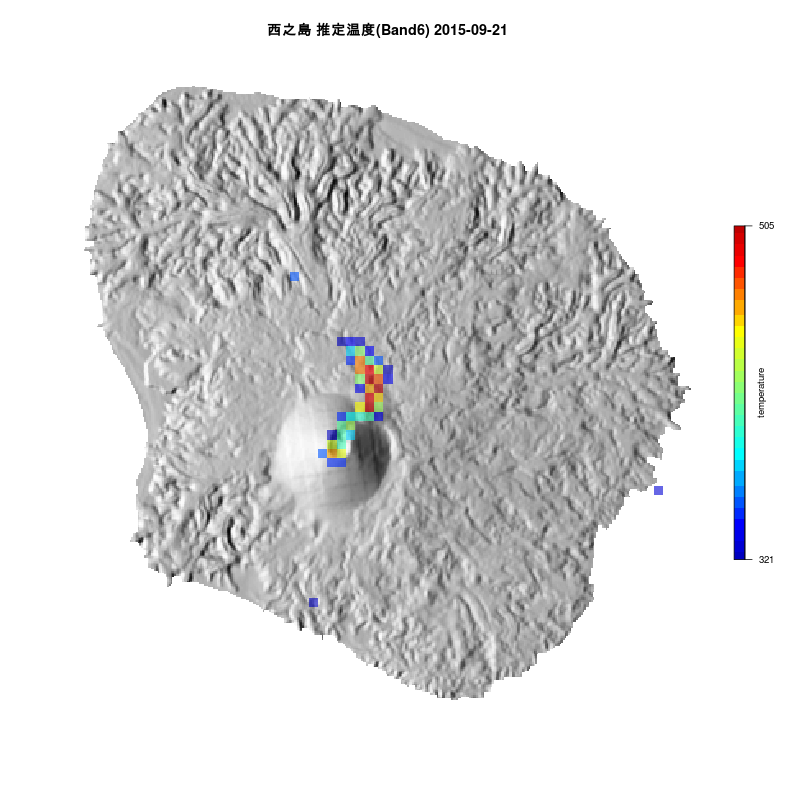
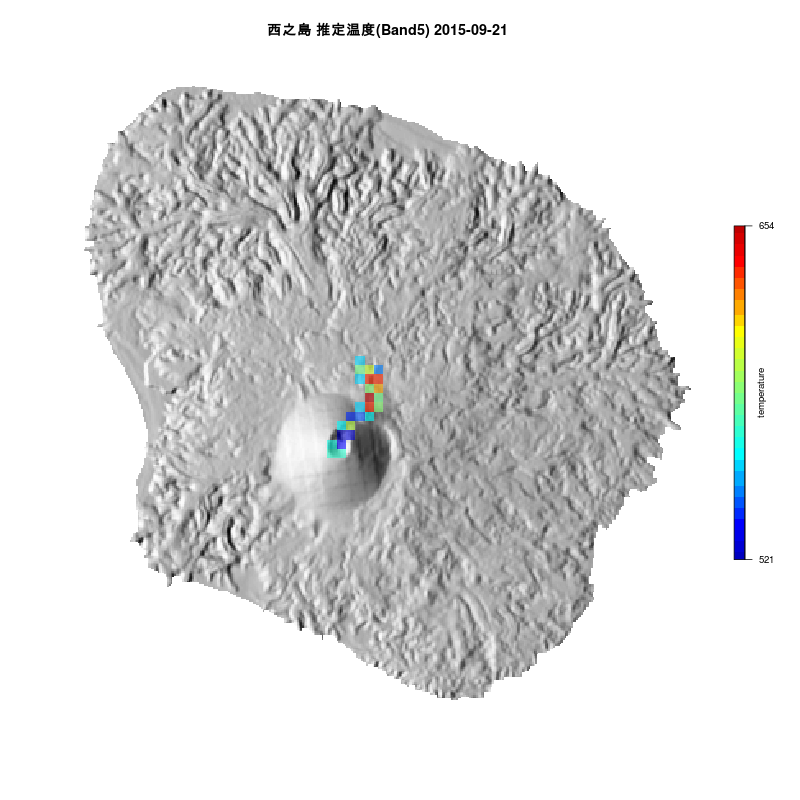
band5,6,7から推定した温度

夜間ランドサットデータによる雲仙火山の表面温度の推移
観測値と地表温度の関係

1
2
3
4
5
6
7
PixelIntegrateTemperature <- function(lambda,Rad,tl=0.92,el=0.82) {
lambda=lambda/10^6
a1=(tl*el*3.742e-16*lambda^(-5))/(pi*Rad)
#Rではlog:自然対数
T=0.0144/(lambda*log(a1+1))
return(T)
}

landsat8

band5 0.85-0.88μm
band6 1.57-1.65μm
band7 2.11-2.29μm

波長lambdaは
band5 0.865 = (0.85+0.88)/2
band6 1.61 = (1.57+1.65)/2
band7 2.2 = (2.11+2.29)/2

大気透過率を0.92、地表放射率を0.82とします。

1
2
3
4
5
6
7
8
9
10
11
12
13
14
15
16
17
18
19
20
21
22
23
24
25
26
27
28
29
30
31
32
33
34
35
36
37
38
39
40
41
42
43
44
45
46
47
48
49
50
#png(paste0(fname,"_2.png"),width=800,height=800)
#band7
#ToTOARadiance(l,"swir2")としてradianceに変換
temp<-PixelIntegrateTemperature(2.2,ToTOARadiance(l,"swir2")*10^6)-273.15
#200℃以下はNAとする。
temp[temp[]<=200]<-NA
plot(hill, col=grey(0:100/100), legend=FALSE,main='西之島 推定温度(Band7) 2015-09-21',box=F,axes=F)
plot(temp,col=blue2green2red(30),legend=F,axes=FALSE,box=FALSE,alpha=0.6,add=T)
r.range <- c(minValue(temp), maxValue(temp))
plot(temp, legend.only=TRUE, col=blue2green2red(30),
legend.width=1, legend.shrink=0.5,
axis.args=list(at=c(r.range[1], r.range[2]),
labels=c(as.character(round(minValue(temp),0)),as.character(round(maxValue(temp),0))),
cex.axis=0.8),
legend.args=list(text='temperature', side=4, font=1, line=0.5, cex=0.8))
#dev.off()
#
#png(paste0(fname,"_3.png"),width=800,height=800)
#band6
#ToTOARadiance(l,"swir1")としてradianceに変換
temp<-PixelIntegrateTemperature(1.61,ToTOARadiance(l,"swir1")*10^6)-273.15
#320℃以下はNAとする。
temp[temp[]<=320]<-NA
plot(hill, col=grey(0:100/100), legend=FALSE,main='西之島 推定温度(Band6) 2015-09-21',box=F,axes=F)
plot(temp,col=blue2green2red(30),legend=F,axes=FALSE,box=FALSE,alpha=0.6,add=T)
r.range <- c(minValue(temp), maxValue(temp))
plot(temp, legend.only=TRUE, col=blue2green2red(30),
legend.width=1, legend.shrink=0.5,
axis.args=list(at=c(r.range[1], r.range[2]),
labels=c(as.character(round(minValue(temp),0)),as.character(round(maxValue(temp),0))),
cex.axis=0.8),
legend.args=list(text='temperature', side=4, font=1, line=0.5, cex=0.8))
#dev.off()
#
#png(paste0(fname,"_4.png"),width=800,height=800)
#band5
#ToTOARadiance(l,"nir")としてradianceに変換
temp<-PixelIntegrateTemperature(0.865,ToTOARadiance(l,"nir")*10^6)-273.15
#520℃以下はNAとする。
temp[temp[]<=520]<-NA
plot(hill, col=grey(0:100/100), legend=FALSE,main='西之島 推定温度(Band5) 2015-09-21',box=F,axes=F)
plot(temp,col=blue2green2red(30),legend=F,axes=FALSE,box=FALSE,alpha=0.6,add=T)
r.range <- c(minValue(temp), maxValue(temp))
plot(temp, legend.only=TRUE, col=blue2green2red(30),
legend.width=1, legend.shrink=0.5,
axis.args=list(at=c(r.range[1], r.range[2]),
labels=c(as.character(round(minValue(temp),0)),as.character(round(maxValue(temp),0))),
cex.axis=0.8),
legend.args=list(text='temperature', side=4, font=1, line=0.5, cex=0.8))
#dev.off()