ランドサット7号のデータ

raster パッケージ

よくわからないけど、とりあえず視覚化してみた。

(参考)
ランドサット
ランドサット衛星画像

ランドサット7号のデータは
Data
から頂きました。(鳥取市が入っているデータ)

鳥取市を含むシーンのパス-ロウはLANDSAT-8衛星による,日本の観測パス/ロウで調べました。

ランドサット7号のband
band1 青 450-520nm
band2 緑 530-610nm
band3 赤 630-690nm
band4 近赤外 750-900nm
band5 中間赤外 1550-1750nm
band6 熱赤外 10400-12500nm
band7 中間赤外 2090-2350nm
(マルチスペクトルの分解能 : 熱赤外60m、それ以外は30m)

ダウンロードしたデータを解凍して/home/user/p111r035_7t20001019_z53 へ
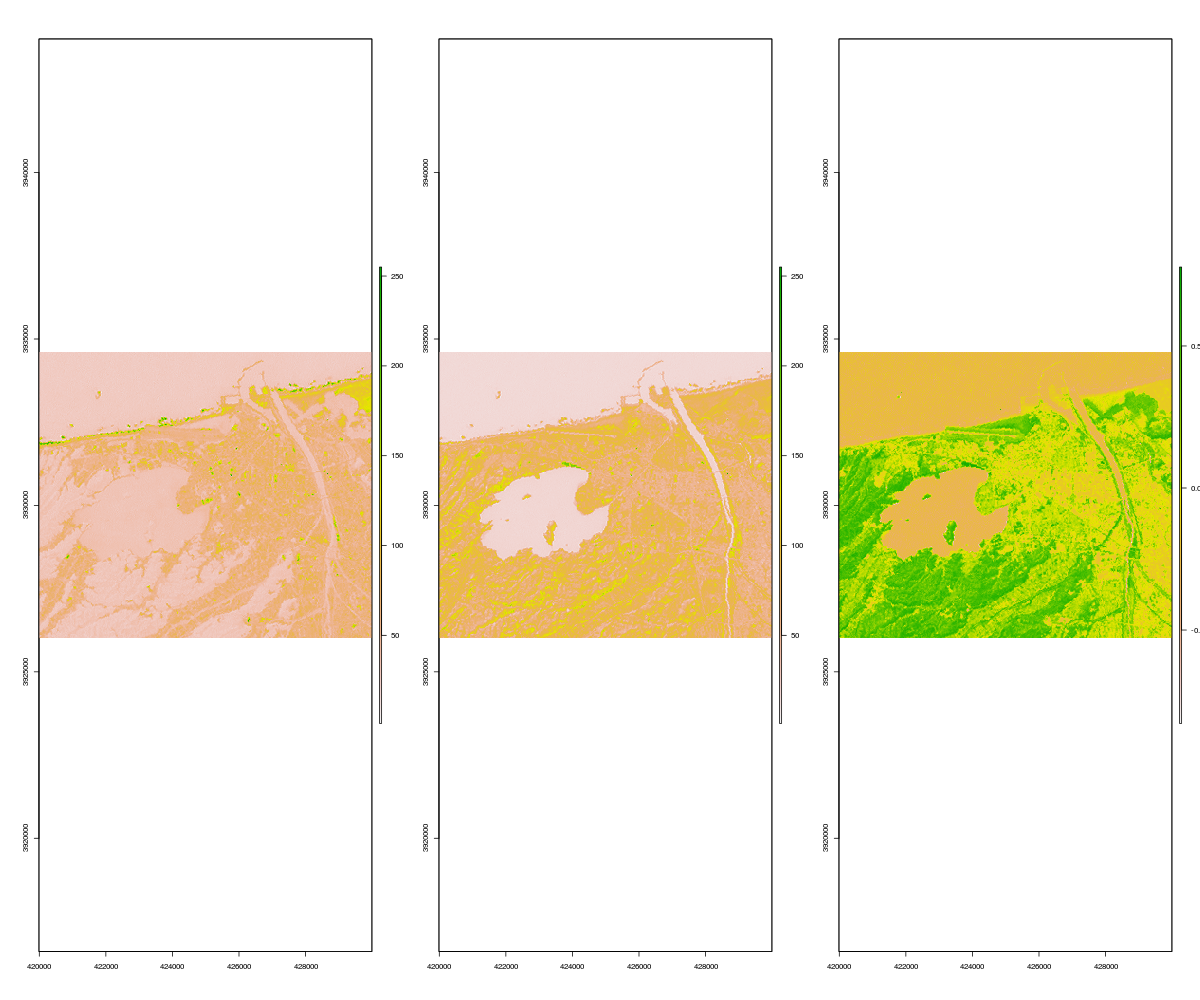
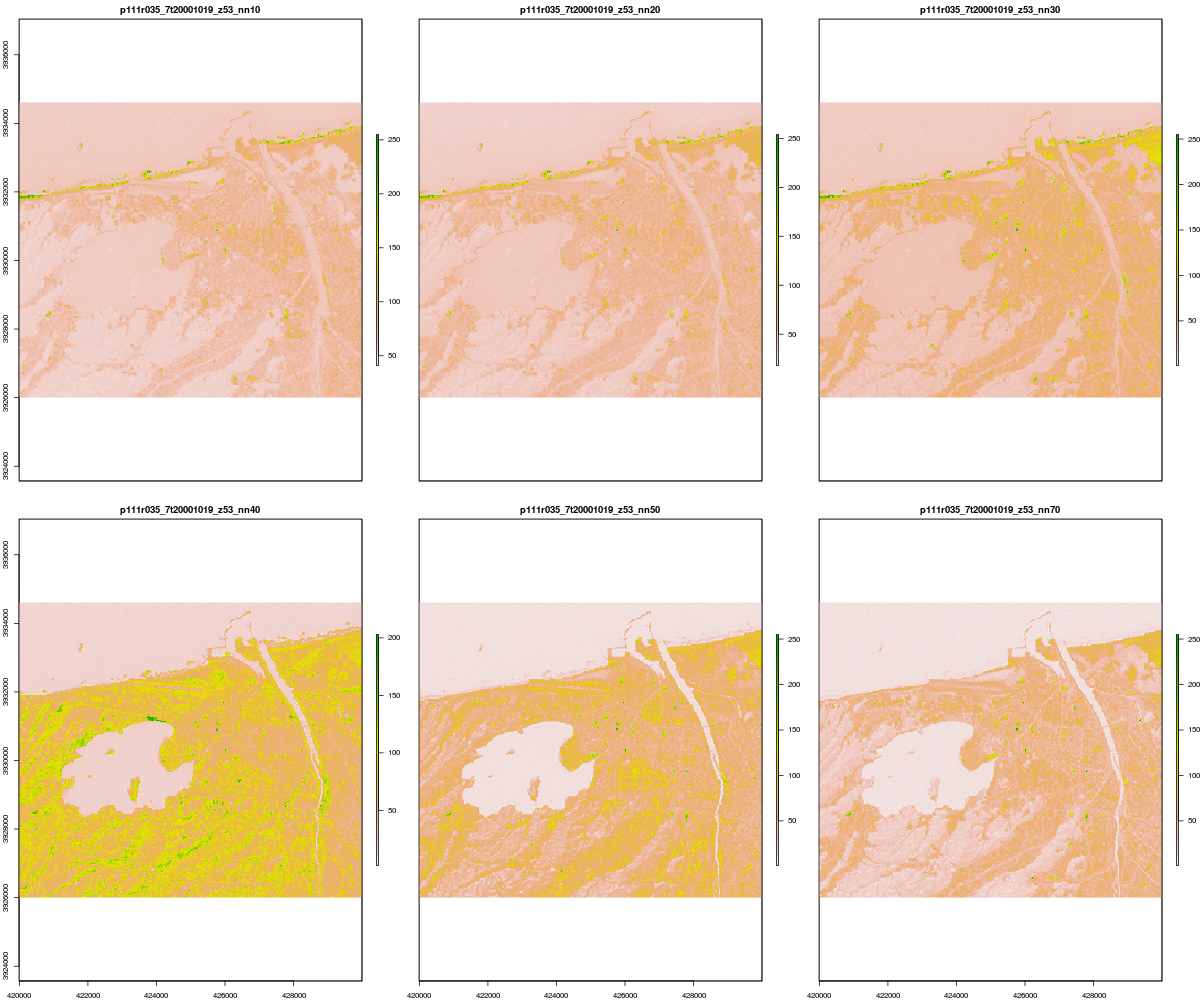
1
2
3
4
5
6
7
8
9
setwd("/home/user/p111r035_7t20001019_z53")
library("raster")
#band 1,2,3,4,5,7(band6:熱赤外はいれていない)
A <- stack(c("p111r035_7t20001019_z53_nn10.tif","p111r035_7t20001019_z53_nn20.tif","p111r035_7t20001019_z53_nn30.tif",
"p111r035_7t20001019_z53_nn40.tif","p111r035_7t20001019_z53_nn50.tif", "p111r035_7t20001019_z53_nn70.tif"))
#str(A)
#png("landsat7_01.png",width=1200,height=1000)
plot(A)
#dev.off()

1
2
3
4
5
6
7
#png("landsat7_02.png",width=1200,height=1000)
par(mfrow=c(1,3))
plotRGB(A,r=3,g=2,b=1) #r=band3,g=band2,b=band1
plotRGB(A,r=3,g=2,b=1,stretch="lin") #r=band3,g=band2,b=band1
plotRGB(A,r=3,g=2,b=1,stretch="hist") #r=band3,g=band2,b=band1
par(mfrow=c(1,1))
#dev.off()

範囲を鳥取市周辺に限定

1
2
3
4
5
6
7
8
9
Crop <- c(420000,430000,3926000,3934600)
#地図を描いてマウスで範囲指定する方法もあり
#plotRGB(A,3,2,1)
# in case you want to make the area smaller:
#Crop <- drawExtent()
A_crop <- crop(A,Crop)
#png("landsat7_03.png",width=1200,height=1000)
plot(A_crop)
#dev.off()

1
2
3
4
5
6
7
#png("landsat7_04.png",width=1200,height=1000)
par(mfrow=c(1,3))
plotRGB(A_crop,r=3,g=2,b=1) #r=band3,g=band2,b=band1
plotRGB(A_crop,r=3,g=2,b=1,stretch="lin") #r=band3,g=band2,b=band1
plotRGB(A_crop,r=3,g=2,b=1,stretch="hist") #r=band3,g=band2,b=band1
par(mfrow=c(1,1))
#dev.off()

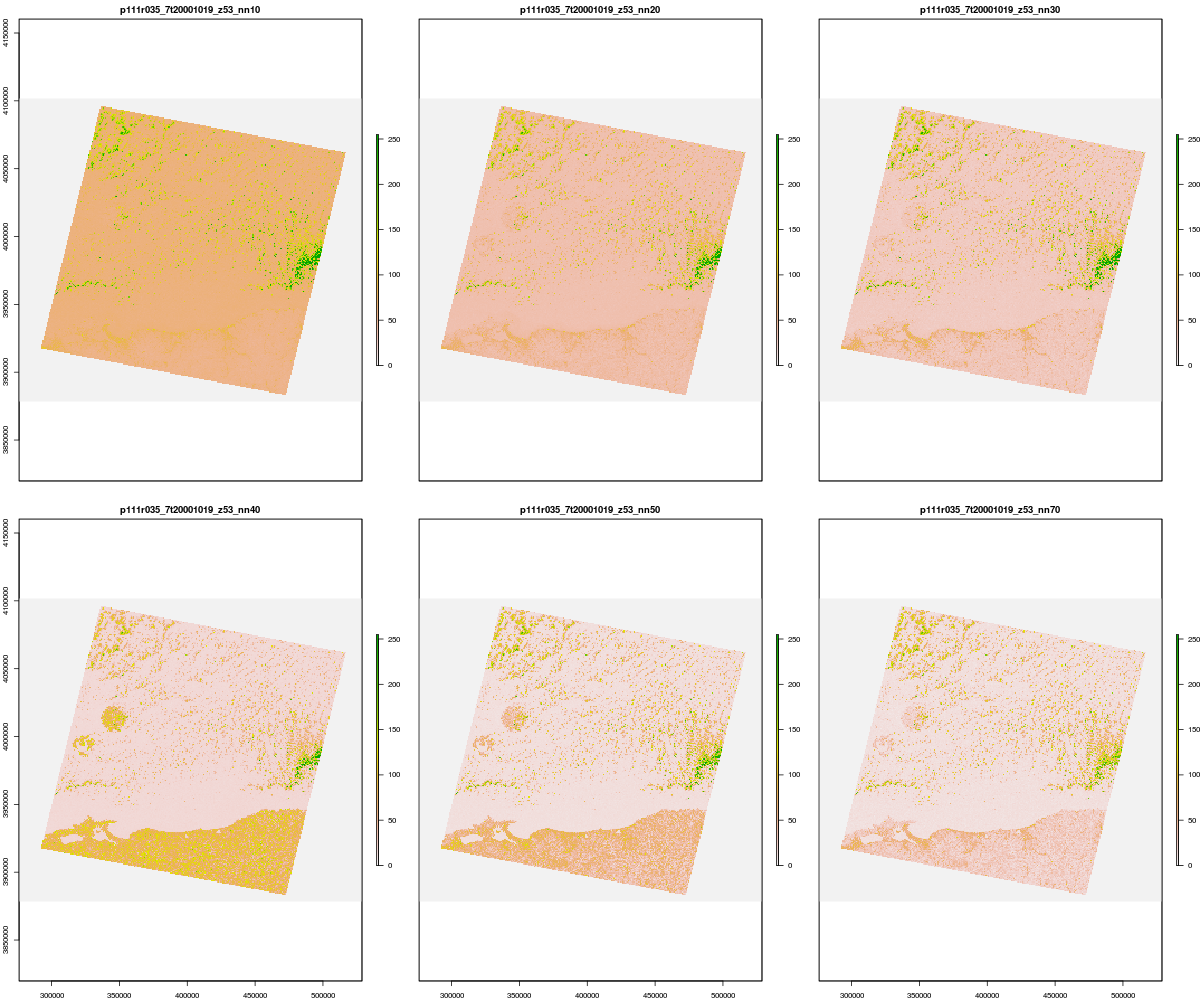
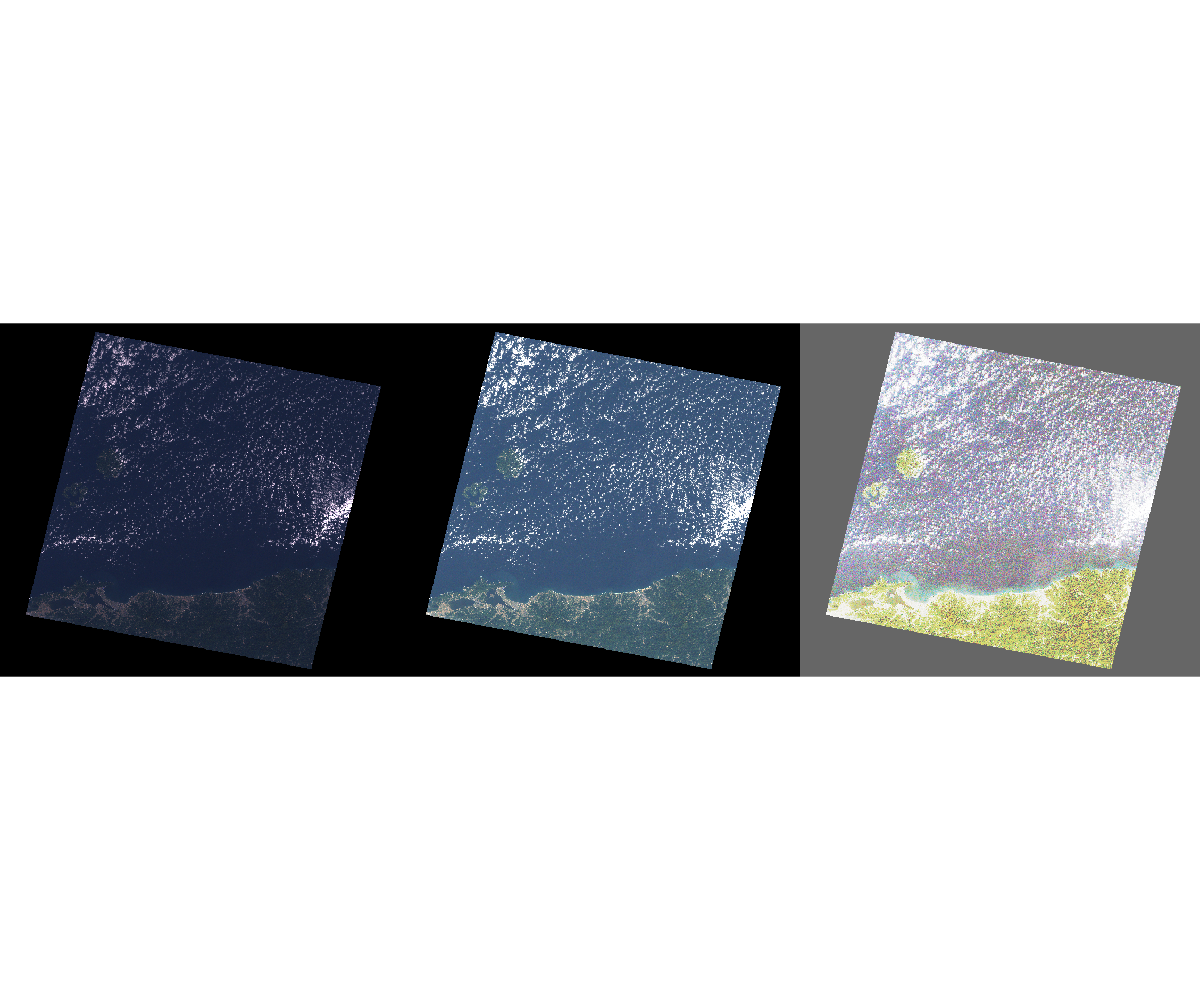
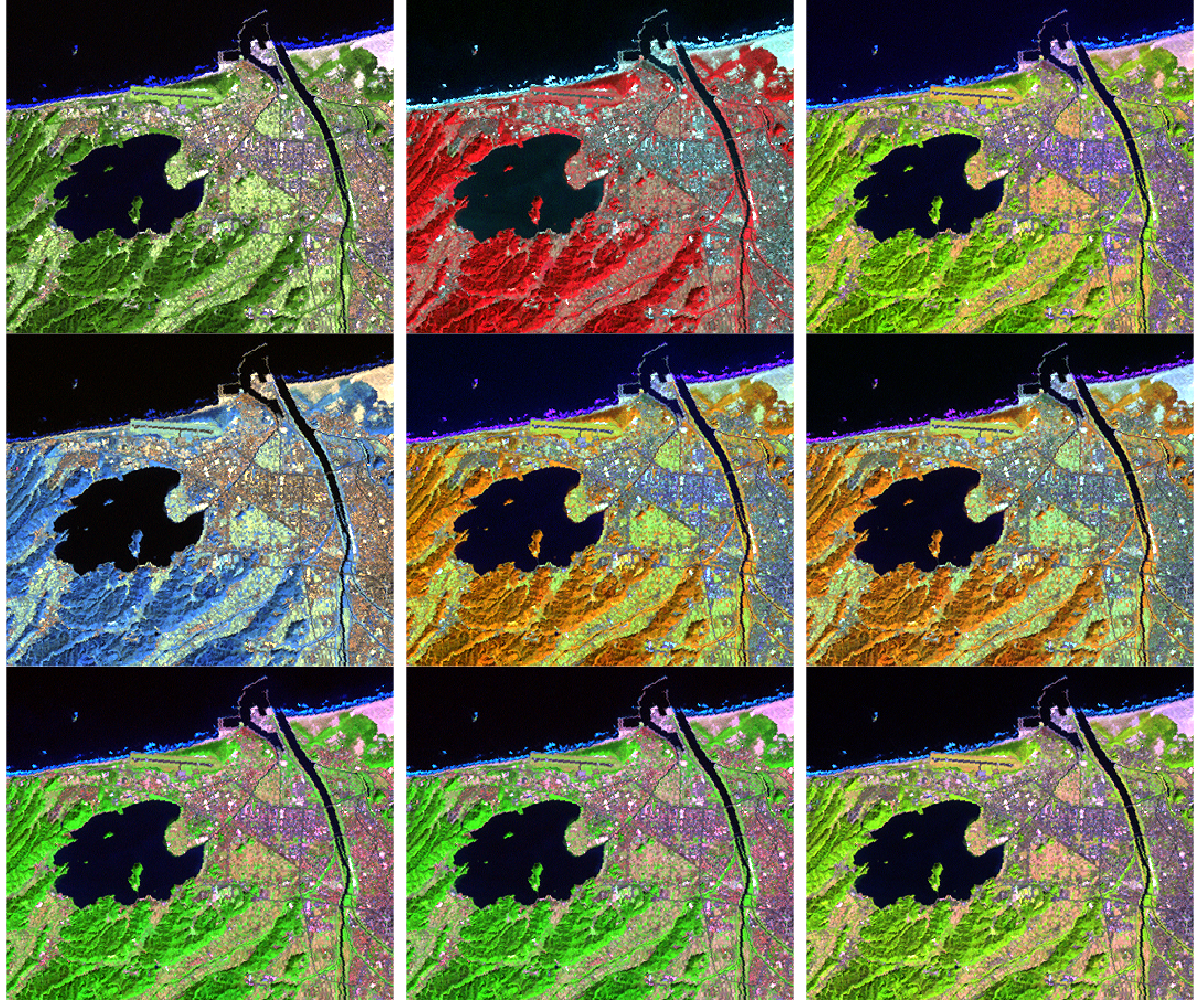
全然わからないけど、とりあえず視覚化してみた。

RGBに入れるバンドの組み合わせを変えてみる。

(参考)
Band Combinations for Landsat 8
ランドサット8号

ランドサット8号

Natural Color 4 3 2
False Color (urban) 7 6 4
Color Infrared (vegetation) 5 4 3
Agriculture 6 5 2
Atmospheric Penetration 7 6 5
Healthy Vegetation 5 6 2
Land/Water 5 6 4
Natural With Atmospheric Removal 7 5 3
Shortwave Infrared 7 5 4
Vegetation Analysis 6 5 4

今回使用したデータはランドサット7号のものだから、

2->1,3->2,4->3,5->4,6->5,7->7

Natural Color 3 2 1
False Color (urban) 7 5 3
Color Infrared (vegetation) 4 3 2
Agriculture 5 4 1
Atmospheric Penetration 7 5 4
Healthy Vegetation 4 5 1
Land/Water 4 5 3
Natural With Atmospheric Removal 7 4 2
Shortwave Infrared 7 4 3
Vegetation Analysis 5 4 3

さらに、データセットにはband6なし。band 1,2,3,4,5,7を使用。

ランドサット7号:7 -> データセット:6

1
2
3
4
5
6
7
8
9
10
11
12
13
14
15
16
17
18
19
20
21
22
#png("landsat7_05.png",width=1200,height=1000)
par(mfrow=c(3,3))
#False Color (urban)
plotRGB(A_crop,6,5,3,stretch="lin")
#Color Infrared (vegetation)
plotRGB(A_crop,4,3,2,stretch="lin")
#Agriculture
plotRGB(A_crop,5,4,1,stretch="lin")
#Atmospheric Penetration
plotRGB(A_crop,6,5,4,stretch="lin")
#Healthy Vegetation
plotRGB(A_crop,4,5,1,stretch="lin")
#Land/Water
plotRGB(A_crop,4,5,3,stretch="lin")
#Natural With Atmospheric Removal
plotRGB(A_crop,6,4,2,stretch="lin")
#Shortwave Infrared
plotRGB(A_crop,6,4,3,stretch="lin")
#Vegetation Analysis
plotRGB(A_crop,5,4,3,stretch="lin")
par(mfrow=c(1,1))
#dev.off()

1
2
3
4
5
6
7
#鳥取市周辺のデータを保存する
#writeRaster(A_crop, filename="tottori_city.tif")
#このデータを使うときには
setwd("/home/user/p111r035_7t20001019_z53")
library("raster")
#band 1,2,3,4,5,7(band6:熱赤外はいれていない)
A_crop<- stack("tottori_city.tif")

(参考)
rgdalパッケージによるリモートセンシング解析 - Researchmap

1
2
3
4
5
6
7
8
9
10
11
#NDVI (正規化植生指数)
#[arcGIS NDVI 関数 ](http://help.arcgis.com/ja/arcgisdesktop/10.0/help/index.html#//009t00000052000000)
#赤色バンドにおけるクロロフィル色素の吸収と
#近赤外バンドにおける植物の細胞構造による高い反射特性を利用
#Landsatの場合(R⇒Band3、IR⇒Band4)
#png("landsat7_06.png",width=1200,height=1000)
par(mfrow=c(1,3))
plot(A_crop[[3]])
plot(A_crop[[4]])
plot((A_crop[[4]]-A_crop[[3]])/(A_crop[[4]]+A_crop[[3]]))
#dev.off()