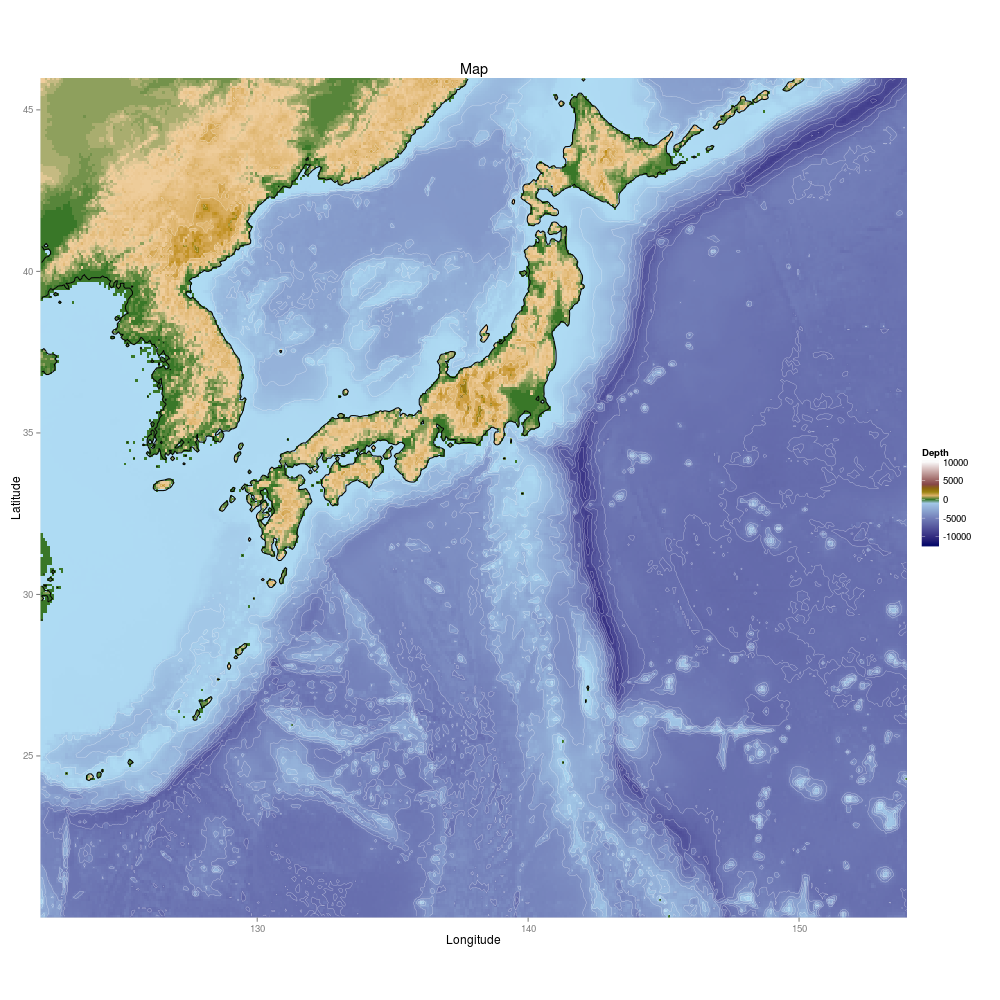
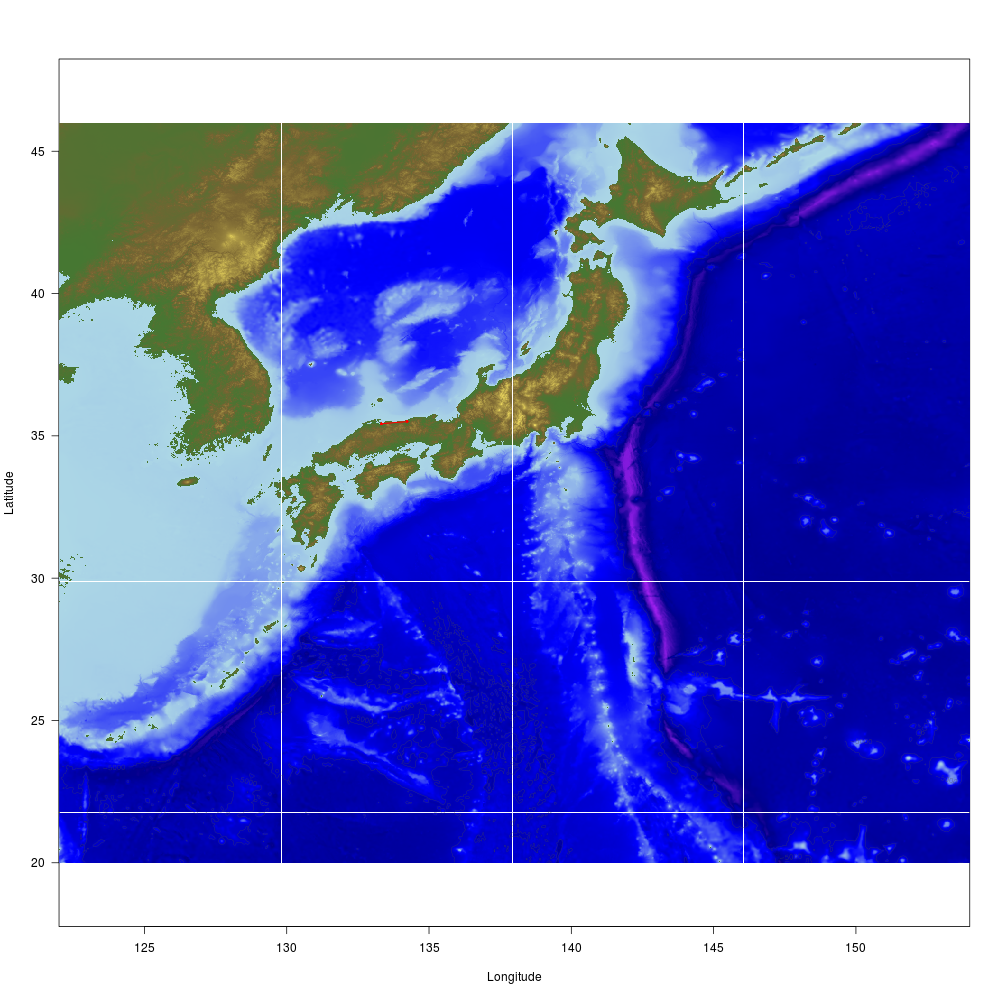
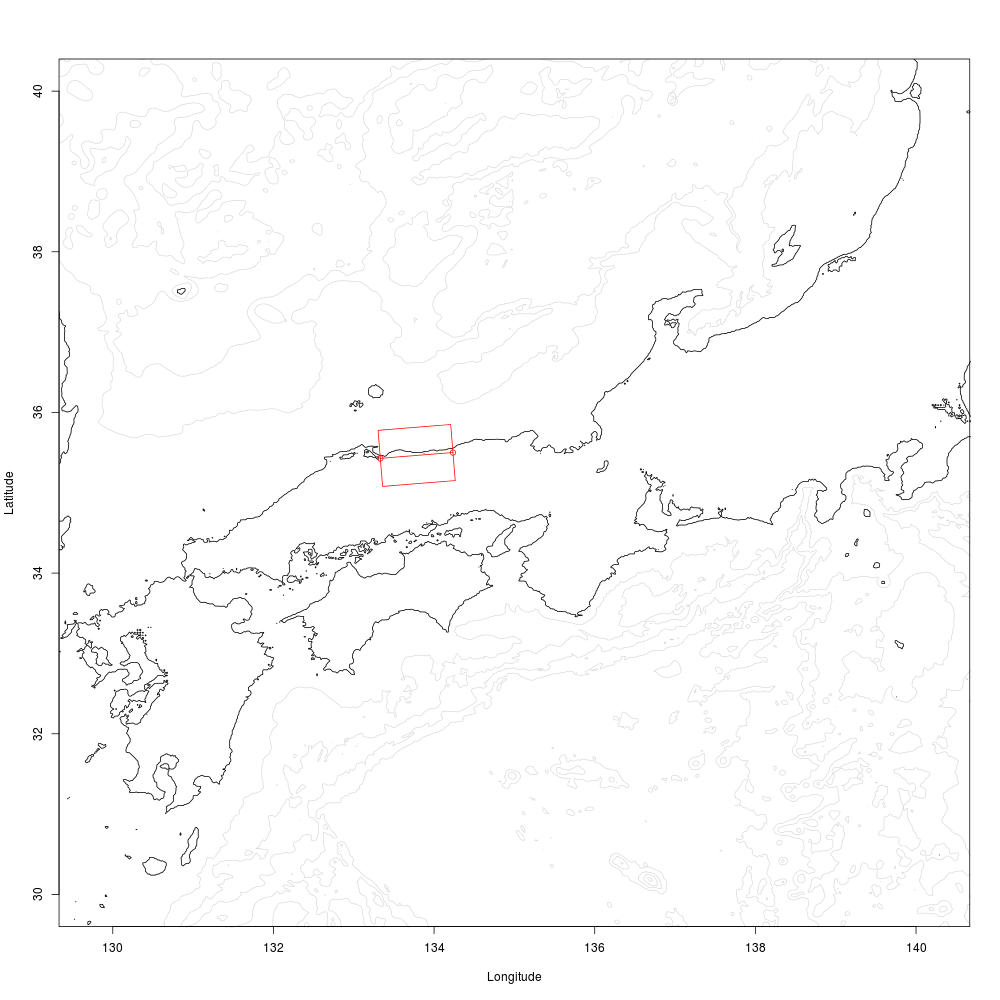
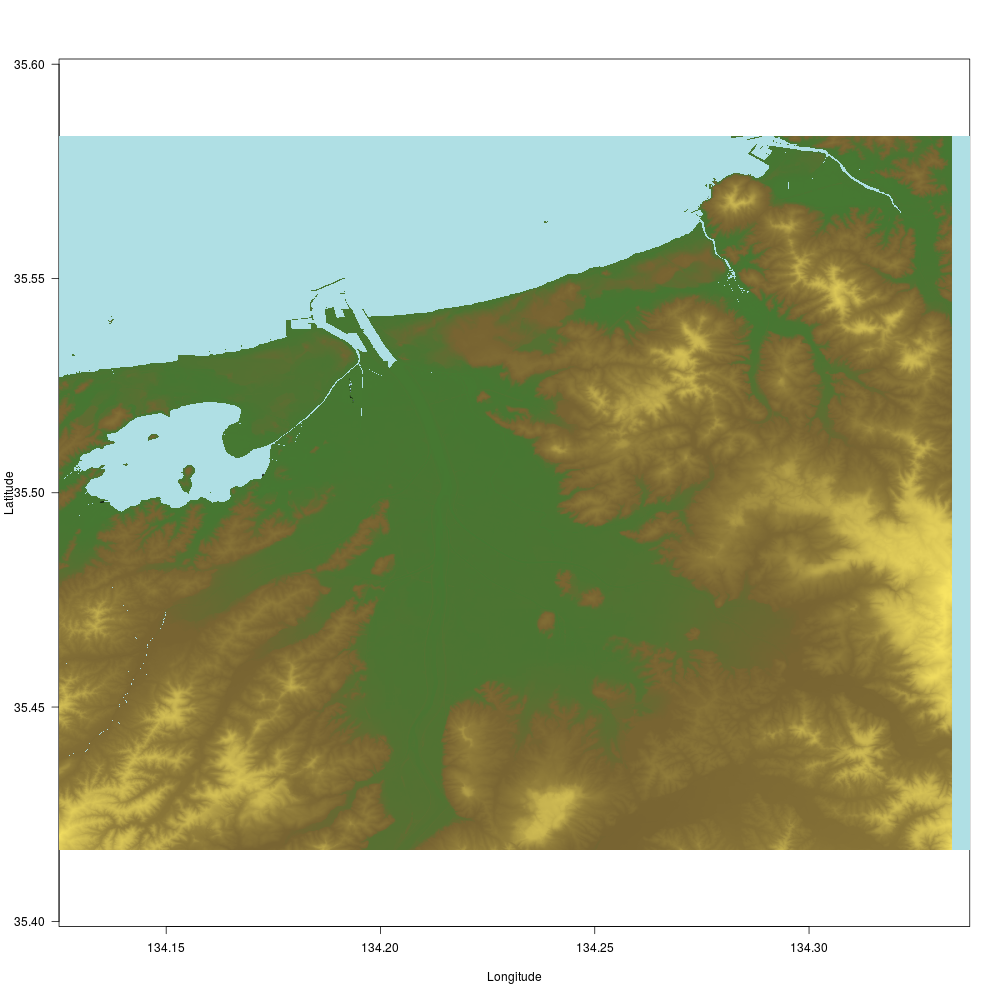
library(marmap) Lon.range = c(122, 154) Lat.range = c(20, 46) dat<-getNOAA.bathy(Lon.range[1],Lon.range[2],Lat.range[1],Lat.range[2],res=5,keep=TRUE) oce <- colorRampPalette(c("purple","darkblue","blue","lightblue")) land1 <- colorRampPalette(c("#467832","#786432")) land2 <- colorRampPalette(c("#786432","#927E3C")) land3 <- colorRampPalette(c("#927E3C","#C6B250")) land4 <- colorRampPalette(c("#C6B250","#FAE664")) land5 <- colorRampPalette(c("#FAE664","#FAEA7E")) plot(dat,image=TRUE,land=TRUE,bpal=list(c(min(dat),0,oce(50)), c(0,500,land1(10)),c(500,1000,land2(10)),c(1000,2000,land3(10)),c(2000,3000,land4(10)),c(3000,max(dat),land5(10))), deep=-10000, shallow=4000, step=1000,col="gray10",drawlabel=F, lwd=0.02,las=1 ) plot(dat,deep=-5000,shallow=-5000,step=0,col="gray30",lwd=0.3,drawlabel=TRUE, add=TRUE) yonago_city<-c(133.331,35.428) tottori_city<-c(134.235,35.501) points(yonago_city[1],yonago_city[2],pch=16,cex=0.5, col="red") points(tottori_city[1],tottori_city[2],pch=16,cex=0.5, col="red") segments(yonago_city[1],yonago_city[2],tottori_city[1],tottori_city[2],col="red",lwd=1.5)
| 