エボラ熱データ

ggplot2, reshape2, XML

参考

Ebola, Wikipedia and data janitors
Ebola virus epidemic in West Africa

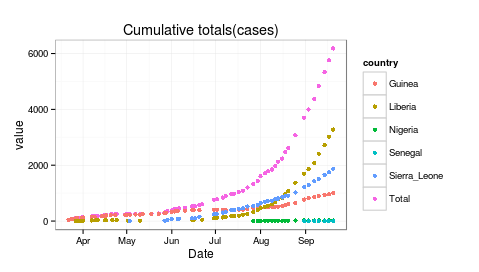
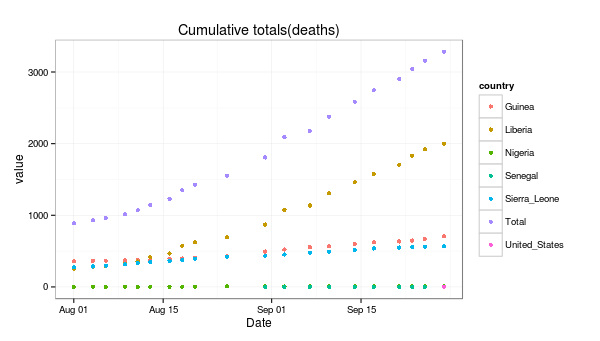
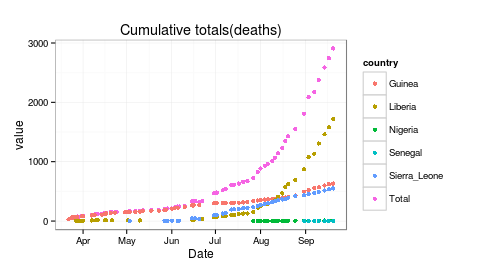
エボラ熱で亡くなった人の数と患者数の推移(国別)

(注意)サイトの更新により下のコードでは取り込めなくなっています。
ebola$”Ebola cases and deaths by country and by date” だったのが
10月3日現在
ebola$”Ebola cases and deaths by country and by date - 1 August to present.”になっています。

1
2
3
4
5
6
7
8
9
10
11
12
13
14
15
16
17
18
library(XML)
library(ggplot2)
library(reshape2)
# get all tables on the page
ebola <- readHTMLTable("http://en.wikipedia.org/wiki/Ebola_virus_epidemic_in_West_Africa",
stringsAsFactors = FALSE)
# thankfully our table has a name; it is table #5
# this is not something you can really automate
head(names(ebola))
# [1] "Ebola virus epidemic in West Africa"
# [2] "Nigeria Ebola areas-2014"
# [3] "Treatment facilities in West Africa"
# [4] "Democratic Republic of Congo-2014"
# [5] "Ebola cases and deaths by country and by date"
# [6] "NULL"
ebola <- ebola$`Ebola cases and deaths by country and by date`
eb<-ebola[-1,1:13] # -1 は1行目はebには入れないということ
eb

参考資料ではRコードのみですべて行っていますが 修正する箇所が多いのでエディタを使いました。(ここまではRを使う必要がなかったかも)

修正したデータを読み込んで、

1
2
3
4
5
6
7
8
9
10
11
12
13
14
15
16
17
18
19
20
21
22
23
24
25
Total <- eb[,1:3]
colnames(Total) <- c("date", "cases", "deaths")
Total1<- melt(Total)
Total1$country<-rep("Total",2*nrow(Total))
Guinea<- eb[, c(1,4,5)]
colnames(Guinea) <- c("date", "cases", "deaths")
Guinea1<- melt(Guinea)
Guinea1$country<-rep("Guinea",2*nrow(Guinea))
Liberia<-eb[, c(1,6,7)]
colnames(Liberia) <- c("date", "cases", "deaths")
Liberia1<- melt(Liberia)
Liberia1$country<-rep("Liberia",2*nrow(Liberia))
Sierra_Leone <-eb[, c(1,8,9)]
colnames(Sierra_Leone) <- c("date", "cases", "deaths")
Sierra_Leone1<-melt(Sierra_Leone)
Sierra_Leone1$country<-rep("Sierra_Leone",2*nrow(Sierra_Leone))
Nigeria<-eb[, c(1,10,11)]
colnames(Nigeria) <- c("date", "cases", "deaths")
Nigeria1<-melt(Nigeria)
Nigeria1$country<-rep("Nigeria",2*nrow(Nigeria))
Senegal<-eb[, c(1,12,13)]
colnames(Senegal) <- c("date", "cases", "deaths")
Senegal1<-melt(Senegal)
Senegal1$country<-rep("Senegal",2*nrow(Senegal))
ebola<-rbind(Total1,Guinea1,Liberia1,Sierra_Leone1,Nigeria1,Senegal1)

亡くなった人の数と患者の数を分けてプロット

「%d」「%m」「%Y」以外のフォーマットを使う場合,日本語環境では数値の代わりに日本語の文字列が入ることによりNA になってしまう.この場合,事前に関数 Sys.setlocale(“LC_TIME”,”C”) を実行する必要がある!!!!!!

参考 種々のベクトル

1
2
3
4
5
6
7
ebola_deaths <- subset(ebola, subset=variable=="deaths")
Sys.setlocale("LC_TIME","C")
ggplot(ebola_deaths, aes(as.Date(date, "%e %b %Y"), value)) +
geom_point(aes(color = country)) +
xlab("Date") +
labs(title = "Cumulative totals(deaths)") +
theme_bw()

1
2
3
4
5
6
7
ebola_cases <- subset(ebola, subset=variable=="cases")
Sys.setlocale("LC_TIME","C")
ggplot(ebola_cases, aes(as.Date(date, "%e %b %Y"), value)) +
geom_point(aes(color = country)) +
xlab("Date") +
labs(title = "Cumulative totals(cases)") +
theme_bw()