問題解決の数理 第4章 ネットワーク計画法2
線形計画問題として解く
最大化
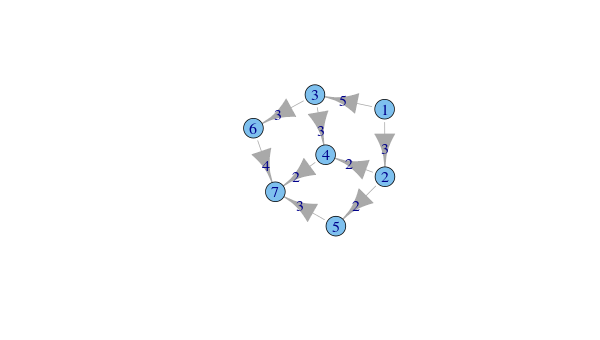
$$\begin{aligned} &f=x_{12}+x_{13} \end{aligned}$$制約条件
$$\begin{aligned} &x_{24}+x_{25}-x_{12}=0\\ &x_{34}+x_{36}-x_{13}=0\\ &x_{47}-x_{24}-x_{34}=0\\ &x_{57}-x_{25}=0\\ &x_{67}-x_{36}=0\\ &0\leq x_{12}\leq3\\ &0\leq x_{13}\leq5\\ &0\leq x_{24}\leq2\\ &0\leq x_{25}\leq2\\ &0\leq x_{34}\leq3\\ &0\leq x_{36}\leq3\\ &0\leq x_{47}\leq2\\ &0\leq x_{57}\leq3\\ &0\leq x_{67}\leq4\\ \end{aligned}$$表にしてみた
| 枝 | 1->2 | 1->3 | 2->4 | 2->5 | 3->4 | 3->6 | 4->7 | 5->7 | 6->7 | 符号 | rhs |
|---|---|---|---|---|---|---|---|---|---|---|---|
| 最大化 | 1 | 1 | 0 | 0 | 0 | 0 | 0 | 0 | 0 | ||
| 点2 | -1 | 0 | 1 | 1 | 0 | 0 | 0 | 0 | 0 | == | 0 |
| 点3 | 0 | -1 | 0 | 0 | 1 | 1 | 0 | 0 | 0 | == | 0 |
| 点4 | 0 | 0 | -1 | 0 | -1 | 0 | 1 | 0 | 0 | == | 0 |
| 点5 | 0 | 0 | 0 | -1 | 0 | 0 | 0 | 1 | 0 | == | 0 |
| 点6 | 0 | 0 | 0 | 0 | 0 | -1 | 0 | 0 | 1 | == | 0 |
| 容量制約 | 1 | 0 | 0 | 0 | 0 | 0 | 0 | 0 | 0 | <= | 3 |
| 容量制約 | 0 | 1 | 0 | 0 | 0 | 0 | 0 | 0 | 0 | <= | 5 |
| 容量制約 | 0 | 0 | 1 | 0 | 0 | 0 | 0 | 0 | 0 | <= | 2 |
| 容量制約 | 0 | 0 | 0 | 1 | 0 | 0 | 0 | 0 | 0 | <= | 2 |
| 容量制約 | 0 | 0 | 0 | 0 | 1 | 0 | 0 | 0 | 0 | <= | 3 |
| 容量制約 | 0 | 0 | 0 | 0 | 0 | 1 | 0 | 0 | 0 | <= | 3 |
| 容量制約 | 0 | 0 | 0 | 0 | 0 | 0 | 1 | 0 | 0 | <= | 2 |
| 容量制約 | 0 | 0 | 0 | 0 | 0 | 0 | 0 | 1 | 0 | <= | 3 |
| 容量制約 | 0 | 0 | 0 | 0 | 0 | 0 | 0 | 0 | 1 | <= | 4 |
Rglpk_solve_LP関数(Rglpkパッケージ)を使う
|
|
$optimum
7
$solution
3 4 1 2 1 3 2 2 3
$status
0
igraphパッケージを使う
|
|

|
|

|
|

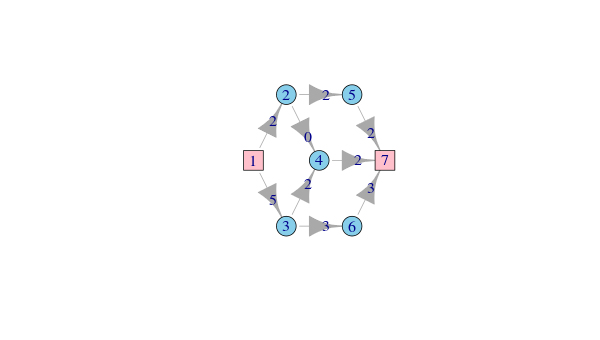
Rglpk_solve_LP関数を使って解いた解とは別の解になっている