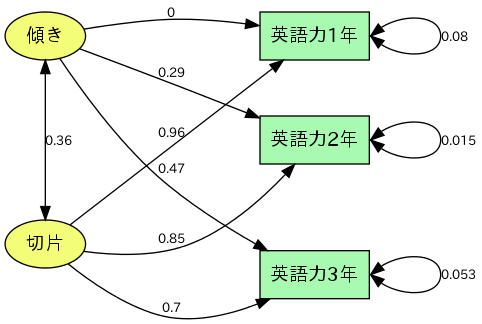
lavaan,gdataパッケージ gawk graphviz
OSはlinux(zorinOS)
windowsではlavaan:::sem使用時に変数名が日本語だとエラーになりました。
(参考)
lavaanチュートリアル(関西大学 荒木先生)
心理データ解析演習(心理デザインデータ解析演習) 構造方程式モデリング(SEM)による成長曲線モデル
|
|
lavaan (0.5-17) converged normally after 41 iterations
Number of observations 500
Estimator ML
Minimum Function Test Statistic 0.768
Degrees of freedom 1
P-value (Chi-square) 0.381
Model test baseline model:
Minimum Function Test Statistic 2091.995
Degrees of freedom 3
P-value 0.000
User model versus baseline model:
Comparative Fit Index (CFI) 1.000
Tucker-Lewis Index (TLI) 1.000
Loglikelihood and Information Criteria:
Loglikelihood user model (H0) -1309.183
Loglikelihood unrestricted model (H1) -1308.799
Number of free parameters 8
Akaike (AIC) 2634.367
Bayesian (BIC) 2668.084
Sample-size adjusted Bayesian (BIC) 2642.691
Root Mean Square Error of Approximation:
RMSEA 0.000
90 Percent Confidence Interval 0.000 0.113
P-value RMSEA <= 0.05 0.618
Standardized Root Mean Square Residual:
SRMR 0.003
Parameter estimates:
Information Expected
Standard Errors Standard
Estimate Std.err Z-value P(>|z|)
Latent variables:
傾き =~
英語力1年 0.000
英語力2年 1.000
英語力3年 2.000
切片 =~
英語力1年 1.000
英語力2年 1.000
英語力3年 1.000
Covariances:
傾き ~~
切片 0.114 0.022 5.160 0.000
Intercepts:
英語力1年 0.000
英語力2年 0.000
英語力3年 0.000
傾き 1.921 0.017 110.097 0.000
切片 3.922 0.044 88.411 0.000
英語力の変化はy=3.922+1.921x として表すことができる。
Variances:
英語力1年 0.081 0.023
英語力2年 0.020 0.013
英語力3年 0.101 0.032
傾き 0.107 0.016
切片 0.928 0.063
|
|
出力は省略
graphをdotファイルに出力。加工。pngファイルに変換。

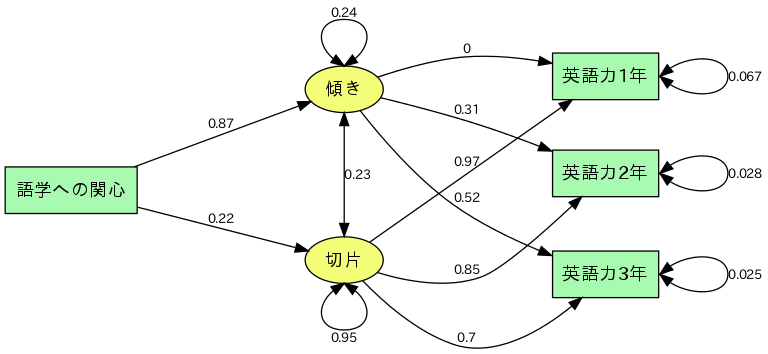
他の変数と組み合わせた分析
|
|
出力は省略
graphをdotファイルに出力。加工。pngファイルに変換。
