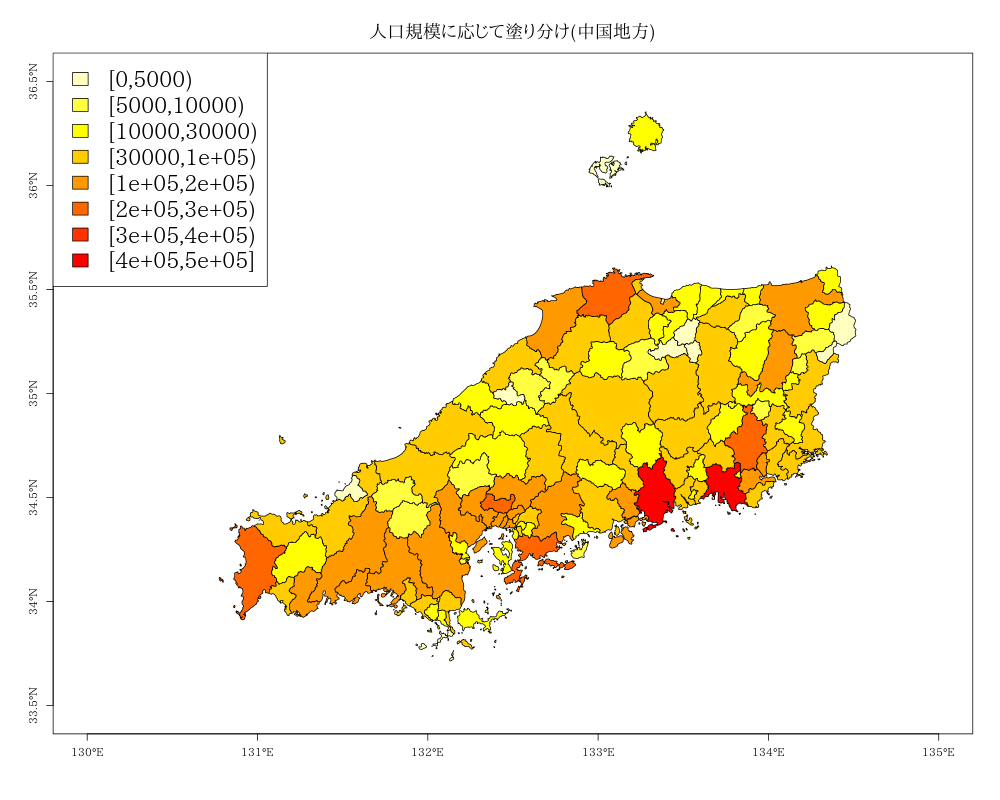
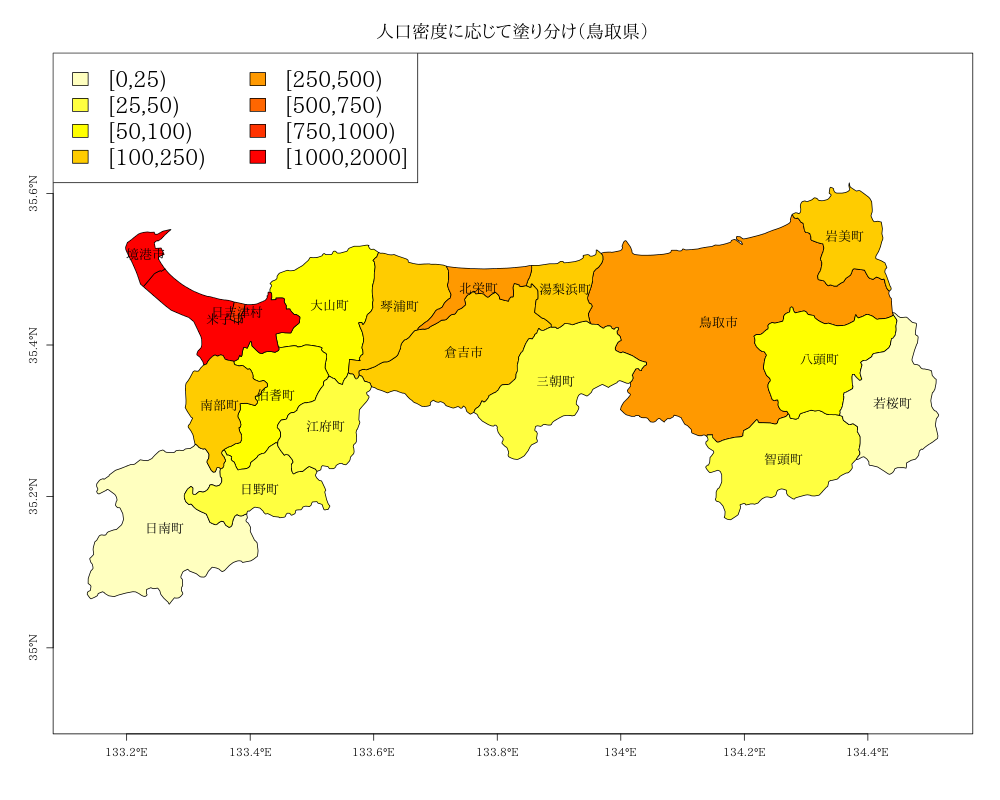
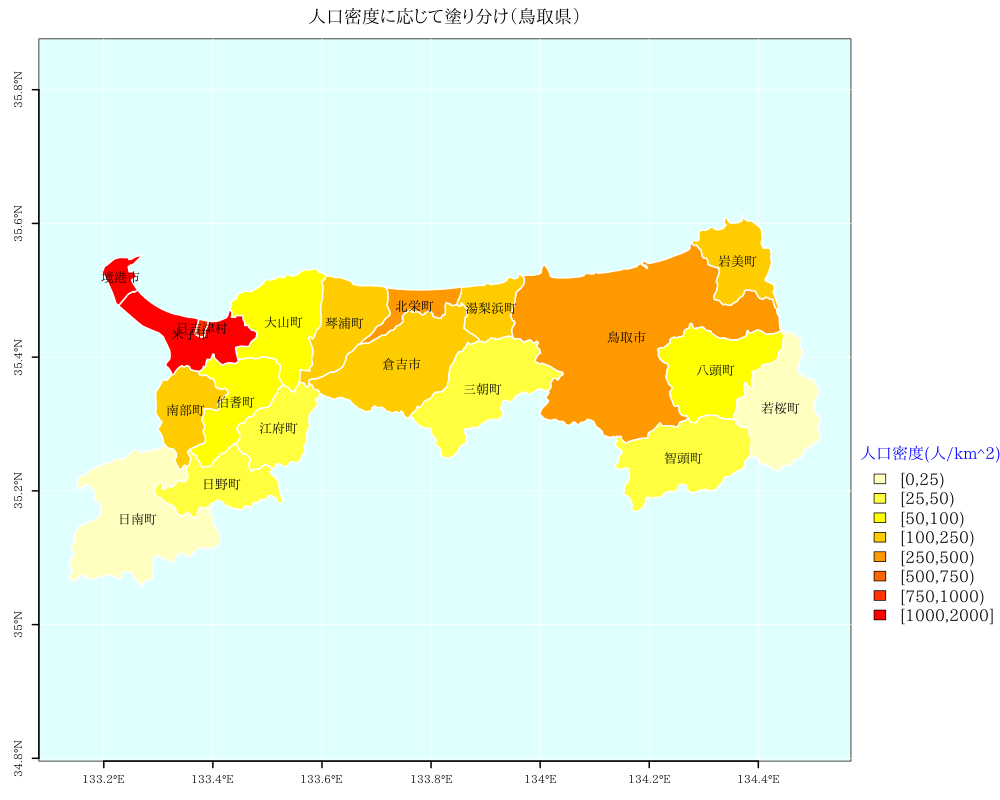
library(maptools) library(classInt) jpn = readShapePoly("JPN/JPN/japan_ver72.shp") proj4string(jpn)="+proj=longlat" Dataset <- read.table("/home/user/R/work/tottori.csv", header=TRUE, sep=",", na.strings="NA", dec=".", strip.white=TRUE) mdata=Dataset;mvar="人口密度"; city=1; ccex=1.2; lloc="topleft";maintxt="人口密度に応じて塗り分け(鳥取県)" jpn.pref <- jpn[jpn$KEN=="鳥取県",] jpn.pref.data = jpn.pref@data par(cex = 0.9,family="Takao P明朝",mar=c(3,3,3,11.5)) DD = merge(mdata, jpn.pref.data, sort=F, by="JCODE", all=T) DD = DD[, colnames(DD) == mvar] col_grad <- rev(heat.colors(8)) intvl <- classIntervals(DD,n=8,style="fixed",fixedBreaks=c(0,25,50,100,250,500,750,1000,2000)) cols <- findColours(intvl,col_grad) plot(jpn.pref, col=cols, border="white",lwd = 2,bg = "lightcyan1", axes=T, panel.first = grid(lty=1,col = "white")) par(xpd=T) legend(par()$usr[2]+0.01 , par()$usr[4] - 0.6 , fill=attr(cols,"palette"), box.lty=0,cex=1.5,ncol=1,legend=names(attr(cols,"table")),title="人口密度(人/km^2)",, title.col ="blue") mtext(maintxt, side=3, cex=1.5, line=1) if (city ==1) { text(getSpPPolygonsLabptSlots(jpn.pref), labels=as.character(jpn.pref$SIKUCHOSON), cex=ccex) } summary(DD)
| 


